溫馨提示×
您好,登錄后才能下訂單哦!
點擊 登錄注冊 即表示同意《億速云用戶服務條款》
您好,登錄后才能下訂單哦!
這篇“R語言怎么使用gganimate創建可視化動圖”文章的知識點大部分人都不太理解,所以小編給大家總結了以下內容,內容詳細,步驟清晰,具有一定的借鑒價值,希望大家閱讀完這篇文章能有所收獲,下面我們一起來看看這篇“R語言怎么使用gganimate創建可視化動圖”文章吧。
#R包安裝
install.packages("devtools")
library(devtools)
install_github("thomasp85/gganimate")
install.packages("gapminder")
#加載
library(gganimate)
library(gapminder)
#查看數據
head(gapminder)
# A tibble: 6 x 6
  country     continent  year lifeExp      pop gdpPercap
  <fct>       <fct>     <int>   <dbl>    <int>     <dbl>
1 Afghanistan Asia       1952    28.8  8425333      779.
2 Afghanistan Asia       1957    30.3  9240934      821.
3 Afghanistan Asia       1962    32.0 10267083      853.
4 Afghanistan Asia       1967    34.0 11537966      836.
5 Afghanistan Asia       1972    36.1 13079460      740.
6 Afghanistan Asia       1977    38.4 14880372      786.
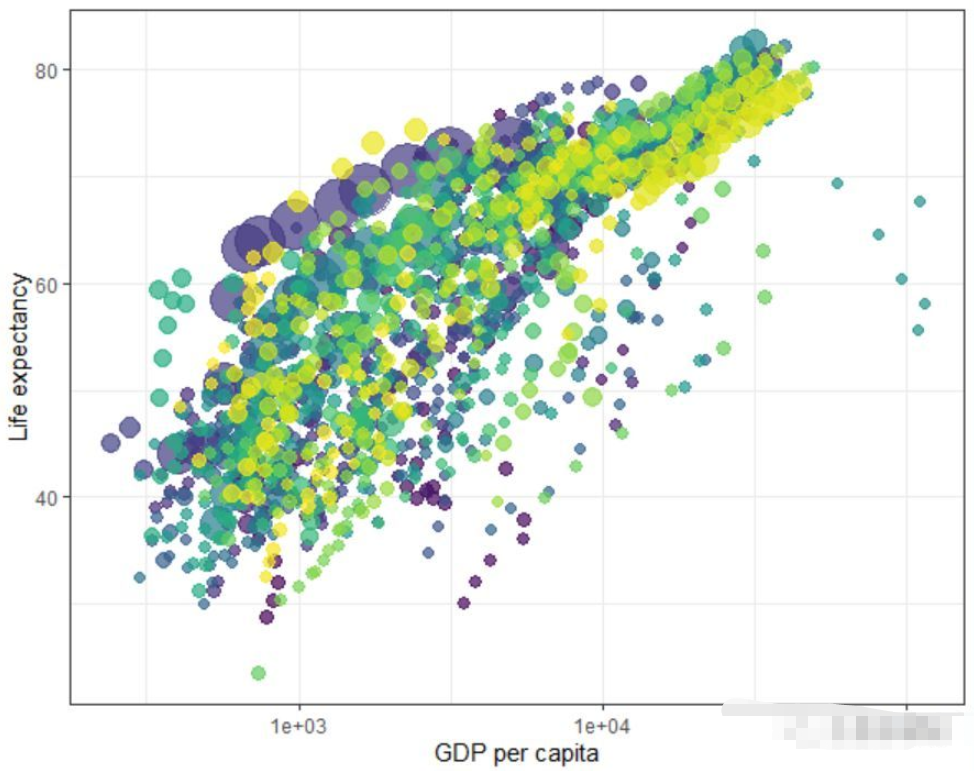
數據集包括全球主要國家在1952-2007年的人均GDP增長、預期壽命以及人口增長的數據 。
使用ggplot2繪制
theme_set(theme_bw())
p <- ggplot(gapminder,
  aes(x = gdpPercap, y=lifeExp, size = pop, colour = country)) +
  geom_point(show.legend = FALSE, alpha = 0.7) +
  scale_color_viridis_d() +
  scale_size(range = c(2, 12)) +
  scale_x_log10() +
  labs(x = "GDP per capita", y = "Life expectancy")
p

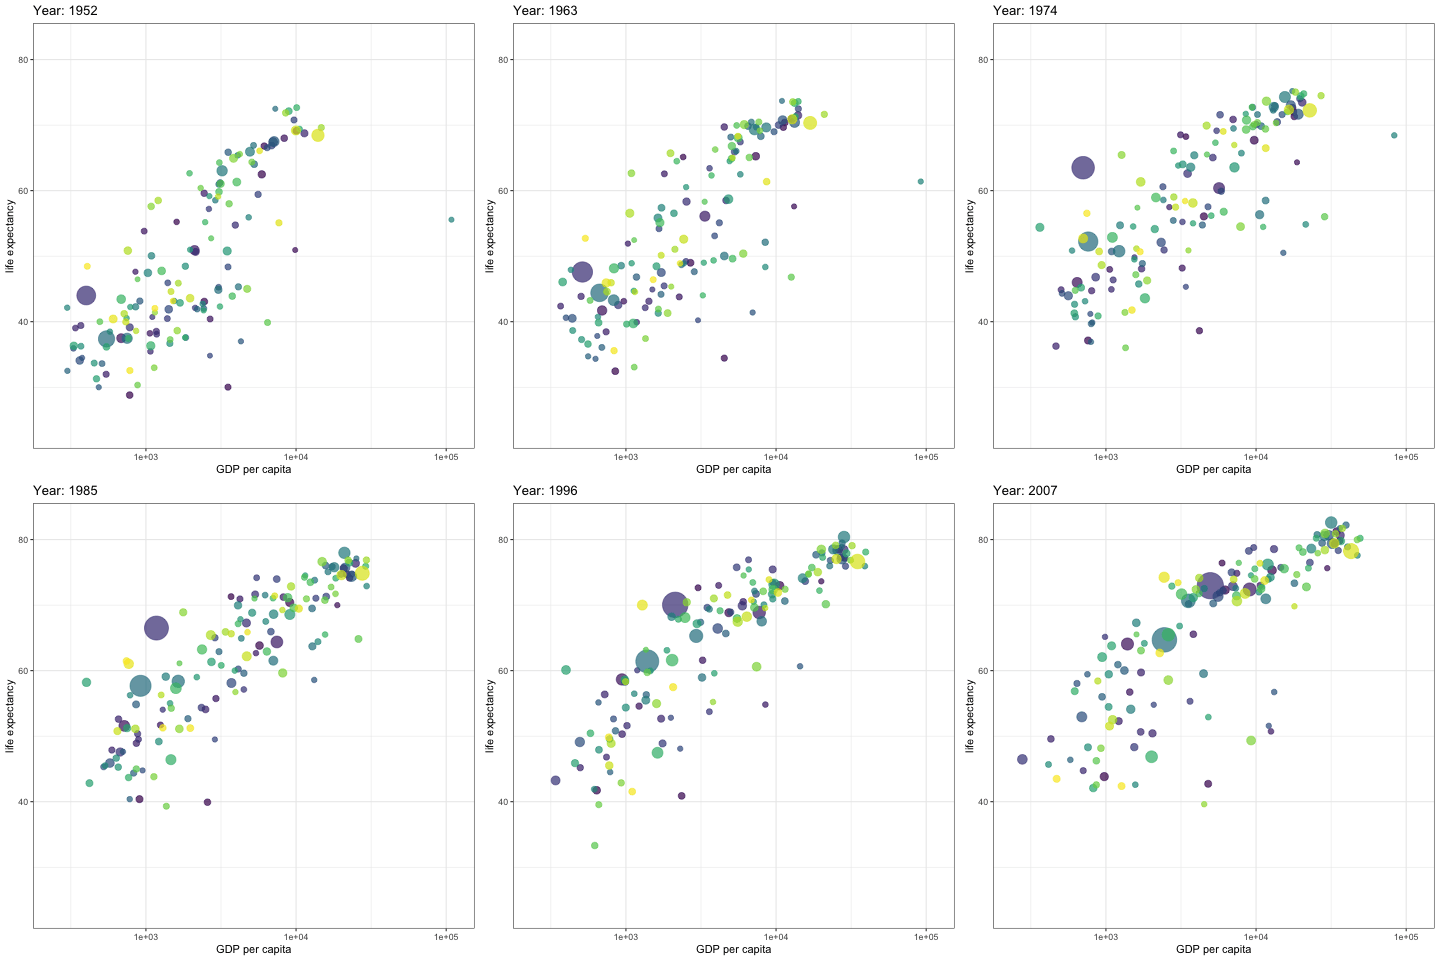
1. transition_time() 核心函數,添加動態
p + transition_time(year) +
  labs(title = "Year: {frame_time}")
2 按需設置
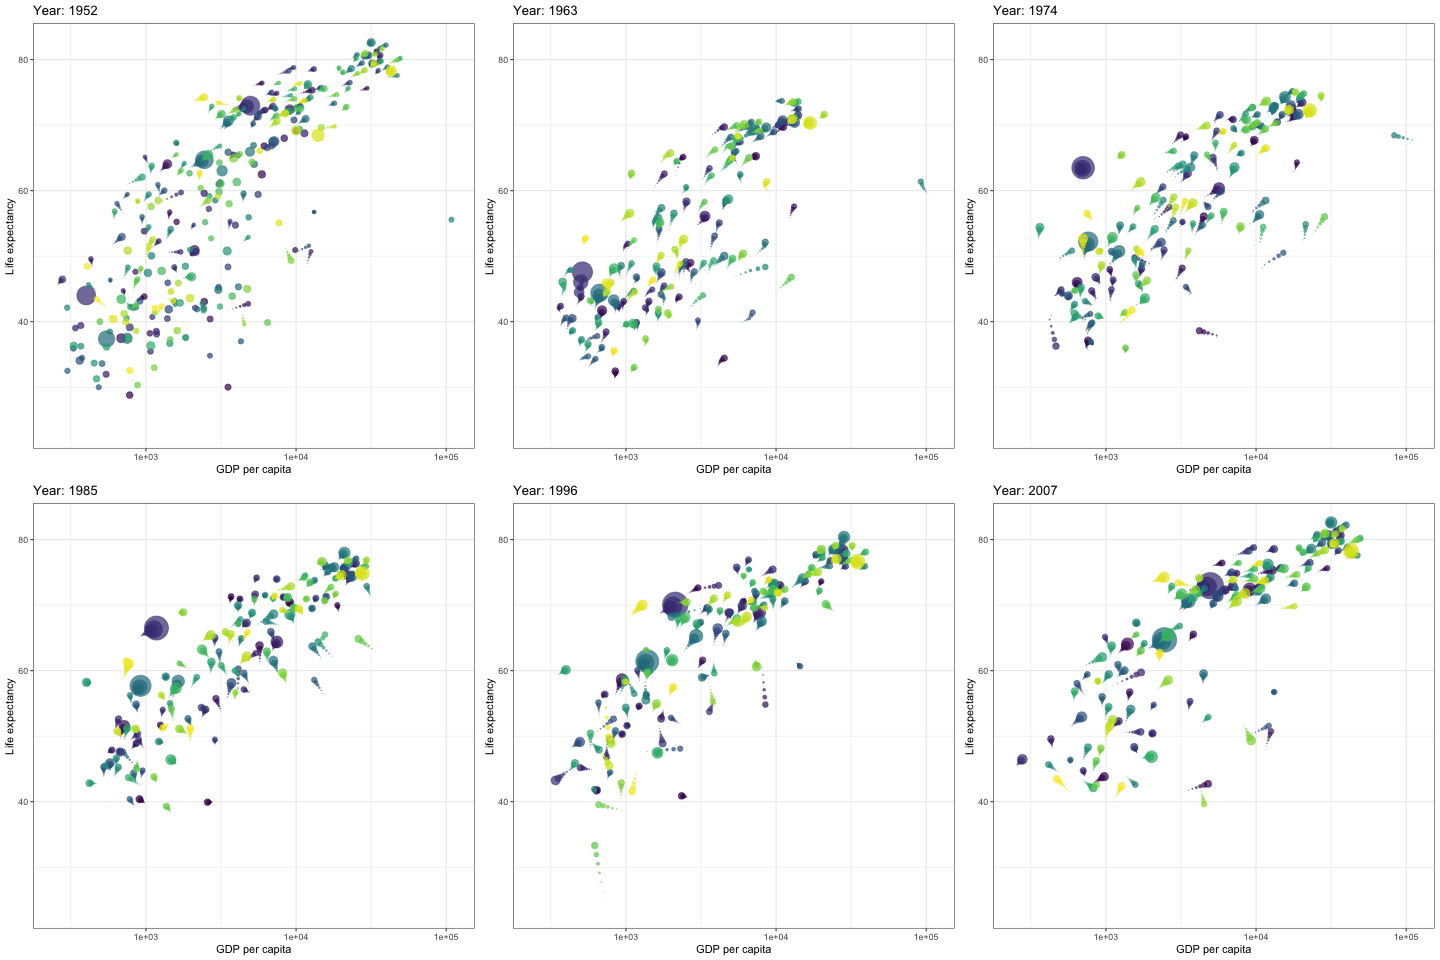
1)添加小尾巴
p + transition_time(year) +
  labs(title = "Year: {frame_time}") +
  shadow_wake(wake_length = 0.1, alpha = FALSE)
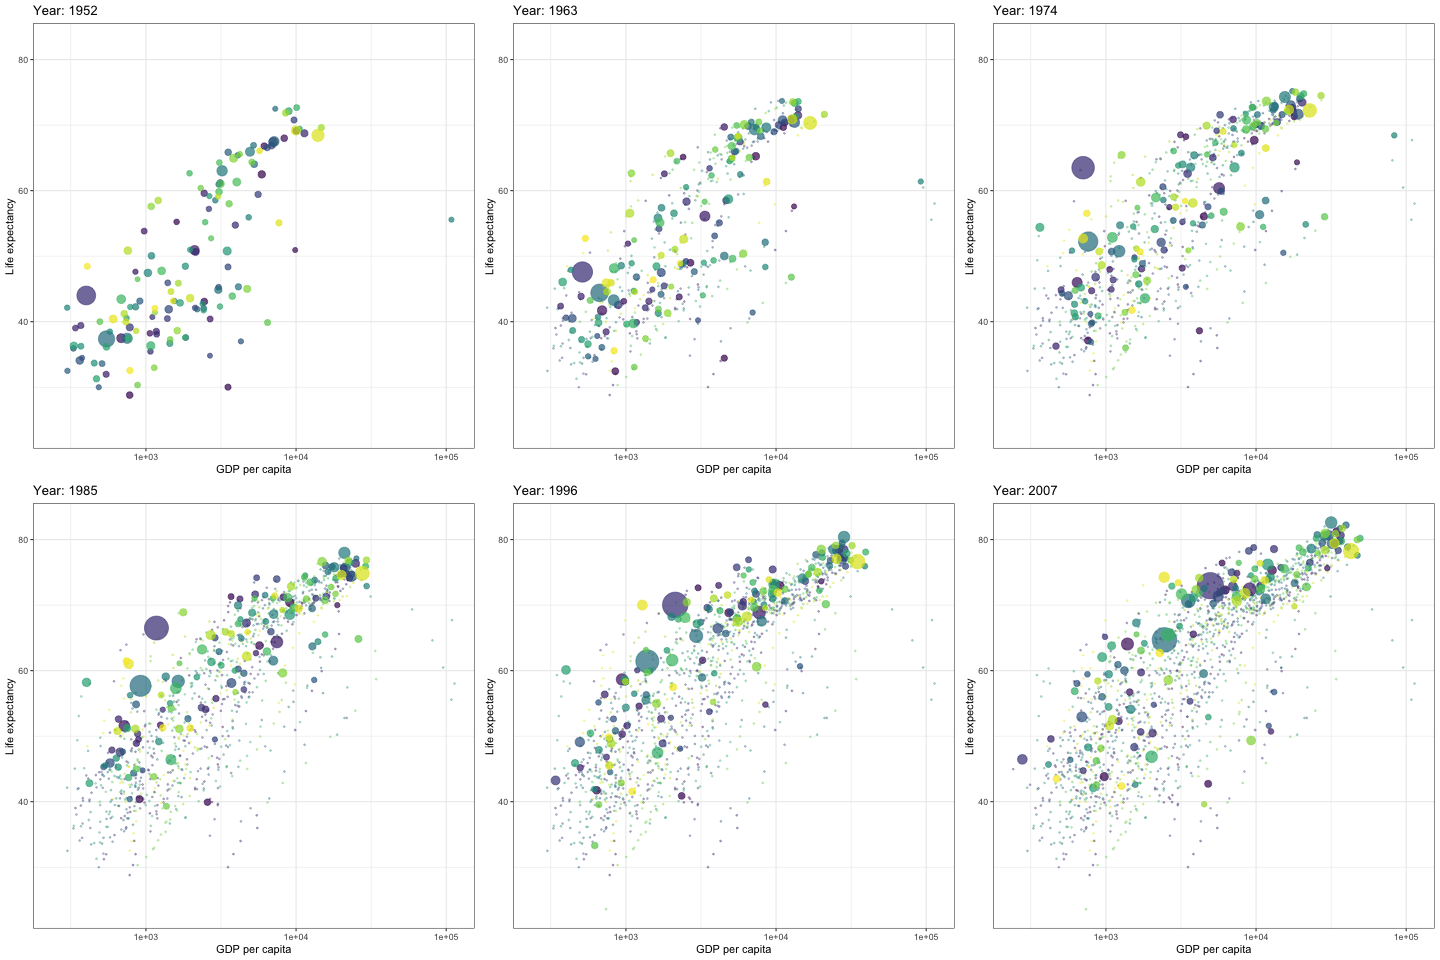
2)原數據做背景
p + transition_time(year) +
  labs(title = "Year: {frame_time}") +
  shadow_mark(alpha = 0.3, size = 0.5)
以上就是關于“R語言怎么使用gganimate創建可視化動圖”這篇文章的內容,相信大家都有了一定的了解,希望小編分享的內容對大家有幫助,若想了解更多相關的知識內容,請關注億速云行業資訊頻道。
免責聲明:本站發布的內容(圖片、視頻和文字)以原創、轉載和分享為主,文章觀點不代表本網站立場,如果涉及侵權請聯系站長郵箱:is@yisu.com進行舉報,并提供相關證據,一經查實,將立刻刪除涉嫌侵權內容。