您好,登錄后才能下訂單哦!
您好,登錄后才能下訂單哦!
本篇內容主要講解“R語言可視化中柱形圖的美化技巧”,感興趣的朋友不妨來看看。本文介紹的方法操作簡單快捷,實用性強。下面就讓小編來帶大家學習“R語言可視化中柱形圖的美化技巧”吧!
昨天以最簡單的單序列柱形圖作為對象詳細的講解了關于套用主題以及圖表美化的思路。
今天就我們常用的幾種柱形圖的衍生圖表——簇狀柱形圖、堆積柱形圖、百分比堆積柱形圖的美化工作進行講解。
我們還是以昨天的數據作為演示數據,同時添加兩年度數據。
data<-data.frame(Name = c("蘋果","谷歌","臉書","亞馬遜","騰訊"),Conpany = c("Apple","Google","Facebook","Amozon","Tencent"),Sale2015 = c(5000,3500,2300,2100,3100),Sale2016 = c(5050,3800,2900,2500,3300))
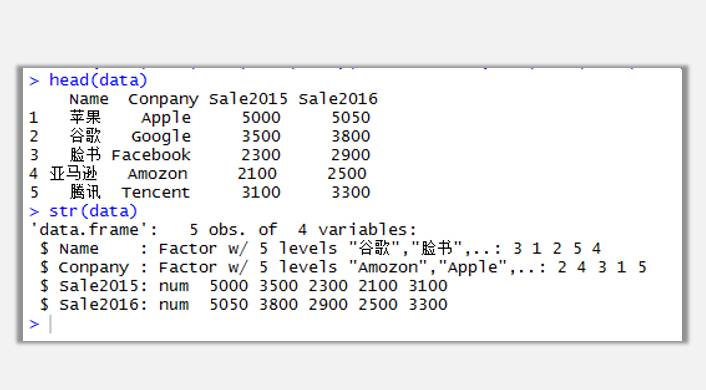
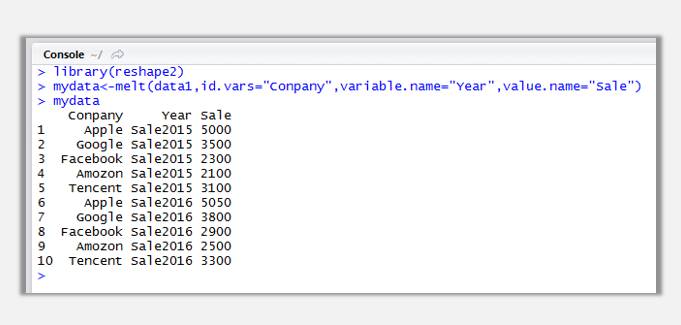
由于今天的案例數據中有兩個年份的數據,其實算是匯總過的二維表(寬數據),不符合R語言圖表數據源的結構(一維表、長數據),所以需要使用reshape2包中的melt函數對數據進行重塑,將其變為長數據進行作圖:
library(reshape2)
mydata <- melt(data1,id.vars="Conpany",variable.name="Year",value.name="Sale")
接下來就要使用語法作圖嘍,一定要瞪大眼睛哦~
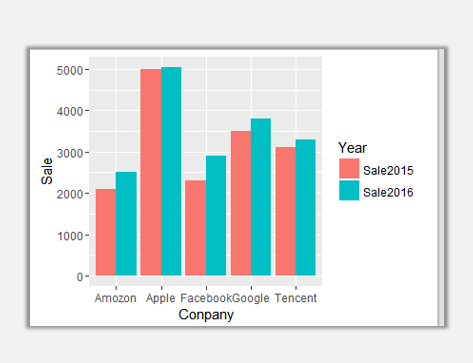
ggplot(mydata,aes(Conpany,Sale,fill=Year))+geom_bar(stat="identity",position="dodge")
套用主題:
ggplot(mydata,aes(Conpany,Sale,fill=Year))+geom_bar(stat="identity",position="dodge")+ggtitle("The Financial Performance of Five Giant")+theme_wsj()+scale_fill_wsj()
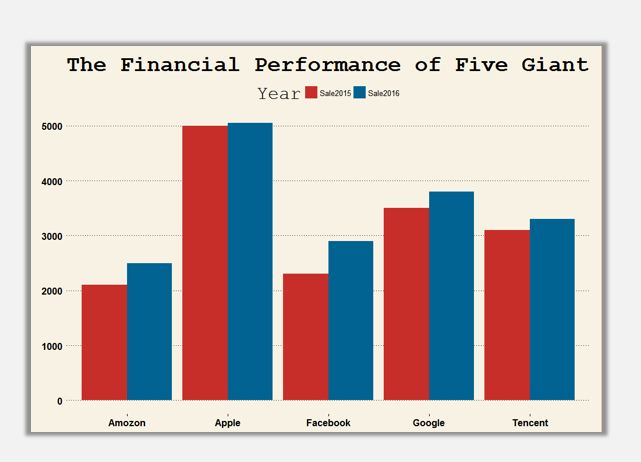
ggplot(mydata,aes(Conpany,Sale,fill=Year))+geom_bar(stat="identity",position="dodge")+ggtitle("The Financial Performance of Five Giant")+theme_wsj()+scale_fill_wsj("rgby", "")
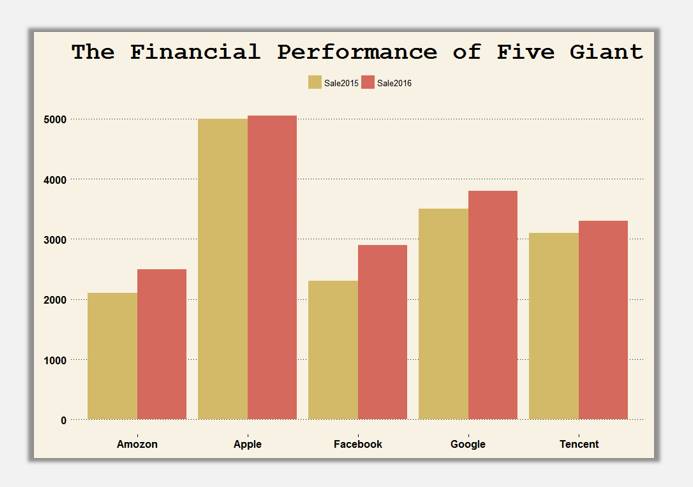
ggplot(mydata,aes(Conpany,Sale,fill=Year))+geom_bar(stat="identity",position="dodge")+ggtitle("The Financial Performance of Five Giant")+theme_wsj()+scale_fill_wsj("rgby", "")+theme(axis.ticks.length=unit(0.5,'cm'))+guides(fill=guide_legend(title=NULL))
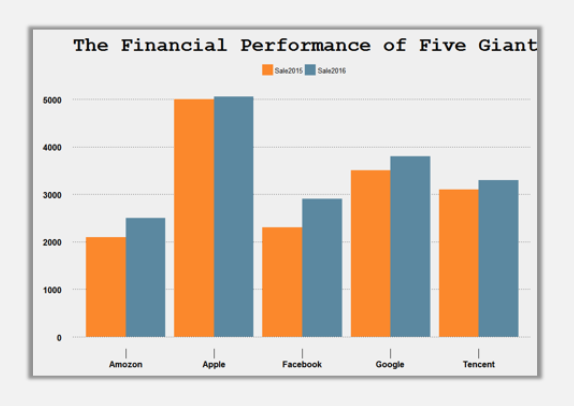
ggplot(mydata,aes(Conpany,Sale,fill=Year))+geom_bar(stat="identity",position="dodge")+ggtitle("The Financial Performance of Five Giant")+theme_economist(base_size=14)+scale_fill_economist()+theme(axis.ticks.length=unit(0.5,'cm'))+guides(fill=guide_legend(title=NULL))
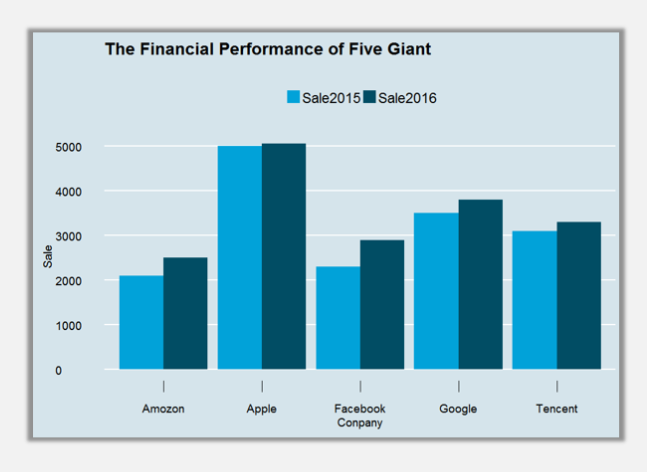
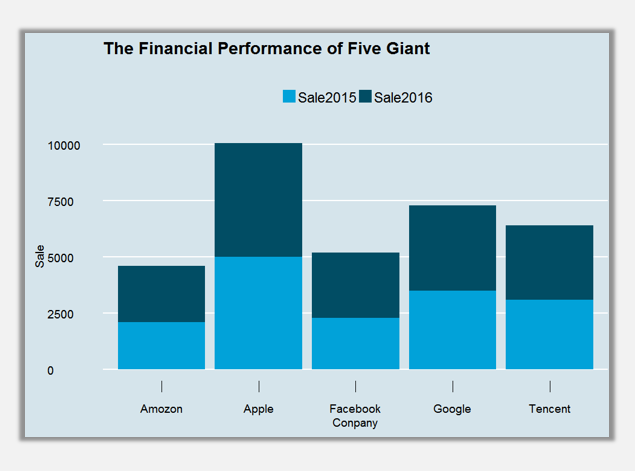
堆積柱形圖套用主題:
ggplot(mydata,aes(Conpany,Sale,fill=Year))+geom_bar(stat="identity",position="stack")+ggtitle("The Financial Performance of Five Giant")+theme_wsj()+scale_fill_wsj("rgby", "")+theme(axis.ticks.length=unit(0.5,'cm'))+guides(fill=guide_legend(title=NULL))
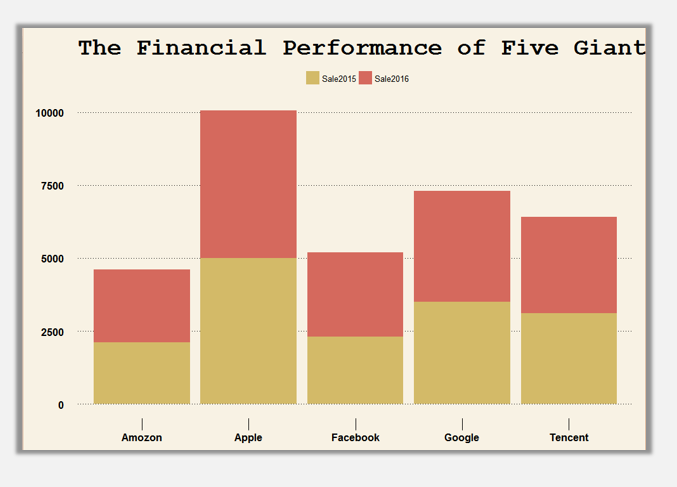
ggplot(mydata,aes(Conpany,Sale,fill=Year))+geom_bar(stat="identity",position="stack")+ggtitle("The Financial Performance of Five Giant")+theme_economist(base_size=14)+scale_fill_economist()+theme(axis.ticks.length=unit(0.5,'cm'))+guides(fill=guide_legend(title=NULL))
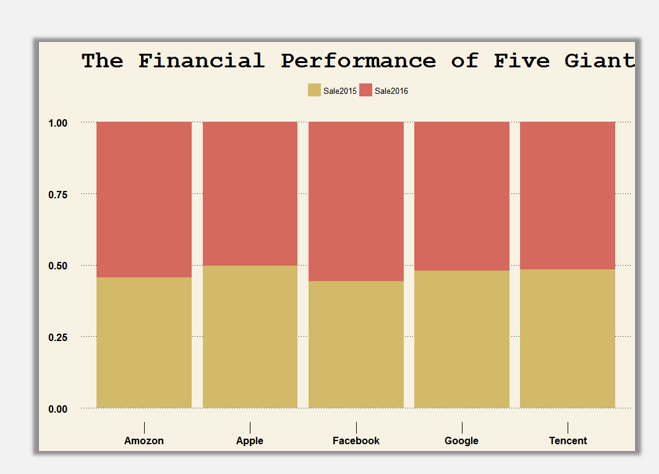
百分比堆積柱形圖套用主題:
ggplot(mydata,aes(Conpany,Sale,fill=Year))+geom_bar(stat="identity",position="fill")+ggtitle("The Financial Performance of Five Giant")+theme_wsj()+scale_fill_wsj("rgby", "")+theme(axis.ticks.length=unit(0.5,'cm'))+guides(fill=guide_legend(title=NULL))
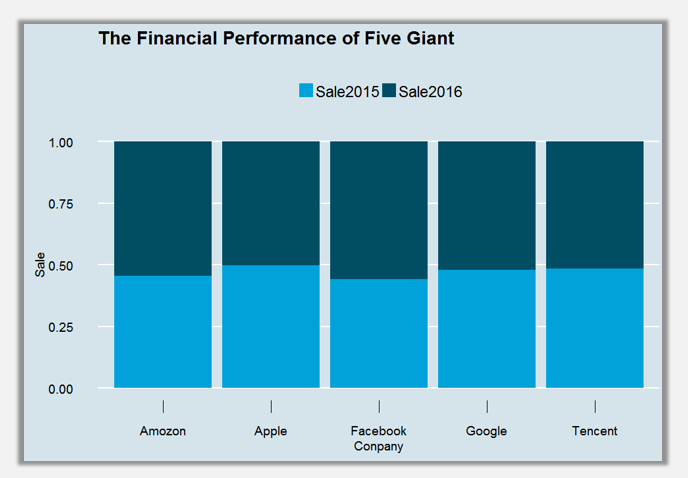
ggplot(mydata,aes(Conpany,Sale,fill=Year))+geom_bar(stat="identity",position="fill")+ggtitle("The Financial Performance of Five Giant")+theme_economist(base_size=14)+scale_fill_economist()+theme(axis.ticks.length=unit(0.5,'cm'))+guides(fill=guide_legend(title=NULL))
將以上所有圖表通過添加旋轉參數調整為條形圖:
簇狀條形形圖:
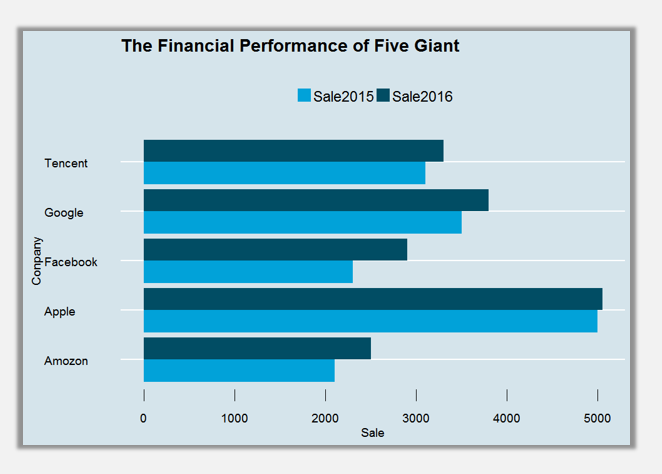
ggplot(mydata,aes(Conpany,Sale,fill=Year))+geom_bar(stat="identity",position="dodge")+ggtitle("The Financial Performance of Five Giant")+theme_wsj()+scale_fill_wsj("rgby", "")+theme(axis.ticks.length=unit(0.5,'cm'))+guides(fill=guide_legend(title=NULL))+coord_flip()
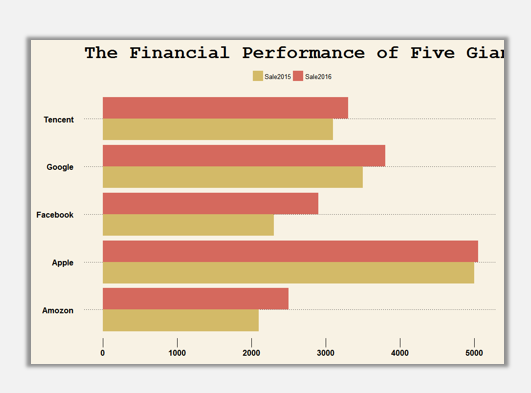
ggplot(mydata,aes(Conpany,Sale,fill=Year))+geom_bar(stat="identity",position="dodge")+ggtitle("The Financial Performance of Five Giant")+theme_economist(base_size=14)+scale_fill_economist()+theme(axis.ticks.length=unit(0.5,'cm'))+guides(fill=guide_legend(title=NULL))+coord_flip()
堆積條形圖:
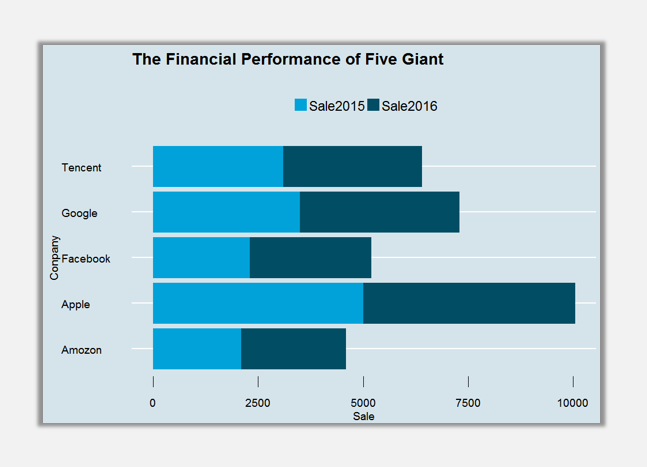
ggplot(mydata,aes(Conpany,Sale,fill=Year))+geom_bar(stat="identity",position="stack")+ggtitle("The Financial Performance of Five Giant")+theme_wsj()+scale_fill_wsj("rgby", "")+theme(axis.ticks.length=unit(0.5,'cm'))+guides(fill=guide_legend(title=NULL))+coord_flip()
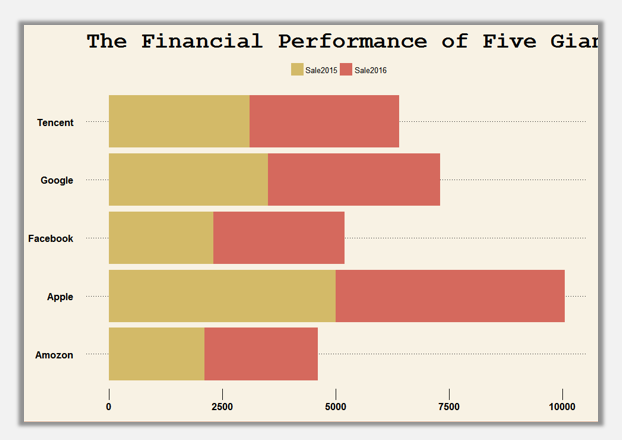
ggplot(mydata,aes(Conpany,Sale,fill=Year))+geom_bar(stat="identity",position="stack")+ggtitle("The Financial Performance of Five Giant")+theme_economist(base_size=14)+scale_fill_economist()+theme(axis.ticks.length=unit(0.5,'cm'))+guides(fill=guide_legend(title=NULL))+coord_flip()
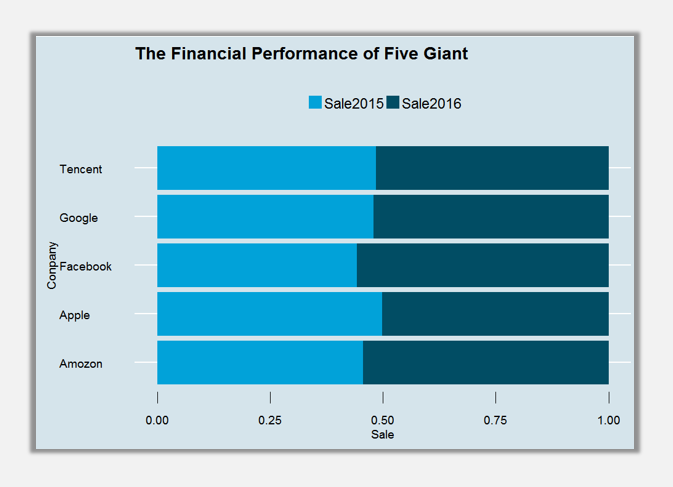
百分比堆積條形圖:
ggplot(mydata,aes(Conpany,Sale,fill=Year))+geom_bar(stat="identity",position="fill")+ggtitle("The Financial Performance of Five Giant")+theme_wsj()+scale_fill_wsj("rgby", "")+theme(axis.ticks.length=unit(0.5,'cm'))+guides(fill=guide_legend(title=NULL))+coord_flip()
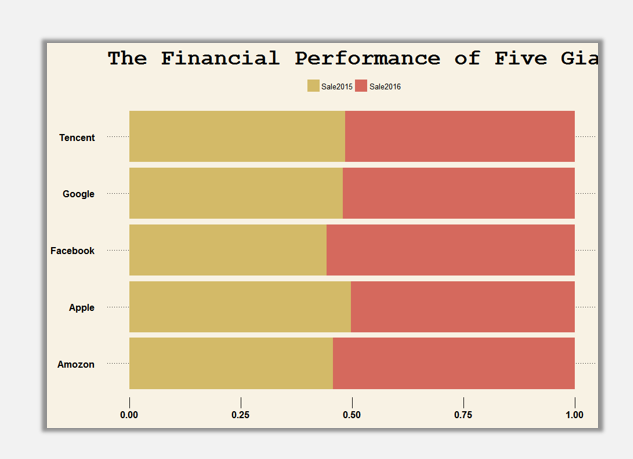
ggplot(mydata,aes(Conpany,Sale,fill=Year))+geom_bar(stat="identity",position="fill")+ggtitle("The Financial Performance of Five Giant")+theme_economist(base_size=14)+scale_fill_economist()+theme(axis.ticks.length=unit(0.5,'cm'))+guides(fill=guide_legend(title=NULL))+coord_flip()
到此,相信大家對“R語言可視化中柱形圖的美化技巧”有了更深的了解,不妨來實際操作一番吧!這里是億速云網站,更多相關內容可以進入相關頻道進行查詢,關注我們,繼續學習!
免責聲明:本站發布的內容(圖片、視頻和文字)以原創、轉載和分享為主,文章觀點不代表本網站立場,如果涉及侵權請聯系站長郵箱:is@yisu.com進行舉報,并提供相關證據,一經查實,將立刻刪除涉嫌侵權內容。