溫馨提示×
您好,登錄后才能下訂單哦!
點擊 登錄注冊 即表示同意《億速云用戶服務條款》
您好,登錄后才能下訂單哦!
使用Java怎么在PPT中添加混合圖表,針對這個問題,這篇文章詳細介紹了相對應的分析和解答,希望可以幫助更多想解決這個問題的小伙伴找到更簡單易行的方法。
Jar文件獲取及導入:
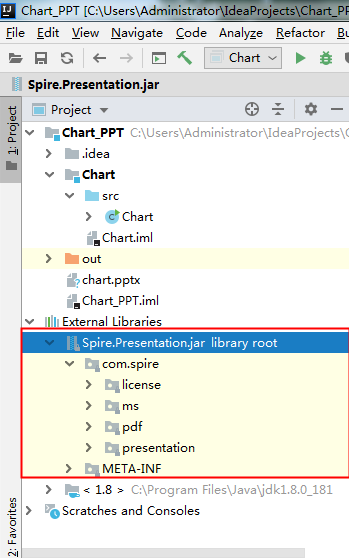
方法1:通過官網下載jar文件包。下載后,解壓文件,并將lib文件夾下的Spire.Presentation.jar導入java程序。參考如下導入效果:

方法2:通過maven倉庫安裝導入。可參考導入方法。
Java代碼示例(供參考)
import com.spire.presentation.*;
import com.spire.presentation.charts.ChartType;
import com.spire.presentation.charts.IChart;
import com.spire.presentation.drawing.FillFormatType;
import java.awt.geom.Rectangle2D;
public class Chart {
  public static void main(String[] args) throws Exception{
    //創建PowerPoint文檔
    Presentation presentation = new Presentation();

    //添加一個柱狀圖
    Rectangle2D.Double rect = new  Rectangle2D.Double(60, 100, 600, 350);
    IChart chart = presentation.getSlides().get(0).getShapes().appendChart(ChartType.COLUMN_CLUSTERED, rect);

    //設置圖表名稱
    chart.getChartTitle().getTextProperties().setText("上半年銷量");
    chart.getChartTitle().getTextProperties().isCentered(true);
    chart.getChartTitle().setHeight(30);
    chart.hasTitle(true);

    //寫入圖表數據
    chart.getChartData().get(0,0).setText("月份");
    chart.getChartData().get(0,1).setText("銷量");
    chart.getChartData().get(0,2).setText("環比增長(%)");
    chart.getChartData().get(1,0).setText("1月");
    chart.getChartData().get(1,1).setNumberValue(120);
    chart.getChartData().get(1,2).setNumberValue(12);
    chart.getChartData().get(2,0).setText("2月");
    chart.getChartData().get(2,1).setNumberValue(100);
    chart.getChartData().get(2,2).setNumberValue(10);
    chart.getChartData().get(3,0).setText("3月");
    chart.getChartData().get(3,1).setNumberValue(80);
    chart.getChartData().get(3,2).setNumberValue(9);
    chart.getChartData().get(4,0).setText("4月");
    chart.getChartData().get(4,1).setNumberValue(120);
    chart.getChartData().get(4,2).setNumberValue(15);
    chart.getChartData().get(5,0).setText("5月");
    chart.getChartData().get(5,1).setNumberValue(90);
    chart.getChartData().get(5,2).setNumberValue(11);
    chart.getChartData().get(6,0).setText("6月");
    chart.getChartData().get(6,1).setNumberValue(110);
    chart.getChartData().get(6,2).setNumberValue(10.5);

    //設置系列標簽數據來源
    chart.getSeries().setSeriesLabel(chart.getChartData().get("B1", "C1"));

    //設置分類標簽數據來源
    chart.getCategories().setCategoryLabels(chart.getChartData().get("A2", "A7"));

    //設置系列的數據來源
    chart.getSeries().get(0).setValues(chart.getChartData().get("B2", "B7"));
    chart.getSeries().get(1).setValues(chart.getChartData().get("C2", "C7"));
    chart.getSeries().get(1).getDataLabels().setLabelValueVisible(true);//設置顯示系列2的數據標簽值
    chart.getSeries().get(1).setType(ChartType.LINE_MARKERS);//將系列2的圖表類型設置為折線圖
    chart.getSeries().get(1).setUseSecondAxis(true);//將系列2繪制在次坐標軸
    chart.getSecondaryValueAxis().getMajorGridTextLines().setFillType(FillFormatType.NONE);//不顯示次坐標軸的網格線

    //設置系列重疊
    chart.setOverLap(-30);

    //設置分類間距
    chart.setGapDepth(200);

    //保存文檔
    presentation.saveToFile("chart.pptx", FileFormat.PPTX_2013);
    presentation.dispose();
  }
}
圖表添加效果:

關于使用Java怎么在PPT中添加混合圖表問題的解答就分享到這里了,希望以上內容可以對大家有一定的幫助,如果你還有很多疑惑沒有解開,可以關注億速云行業資訊頻道了解更多相關知識。
免責聲明:本站發布的內容(圖片、視頻和文字)以原創、轉載和分享為主,文章觀點不代表本網站立場,如果涉及侵權請聯系站長郵箱:is@yisu.com進行舉報,并提供相關證據,一經查實,將立刻刪除涉嫌侵權內容。