溫馨提示×
您好,登錄后才能下訂單哦!
點擊 登錄注冊 即表示同意《億速云用戶服務條款》
您好,登錄后才能下訂單哦!
這篇文章主要介紹“怎么用python畫條形圖”,在日常操作中,相信很多人在怎么用python畫條形圖問題上存在疑惑,小編查閱了各式資料,整理出簡單好用的操作方法,希望對大家解答”怎么用python畫條形圖”的疑惑有所幫助!接下來,請跟著小編一起來學習吧!
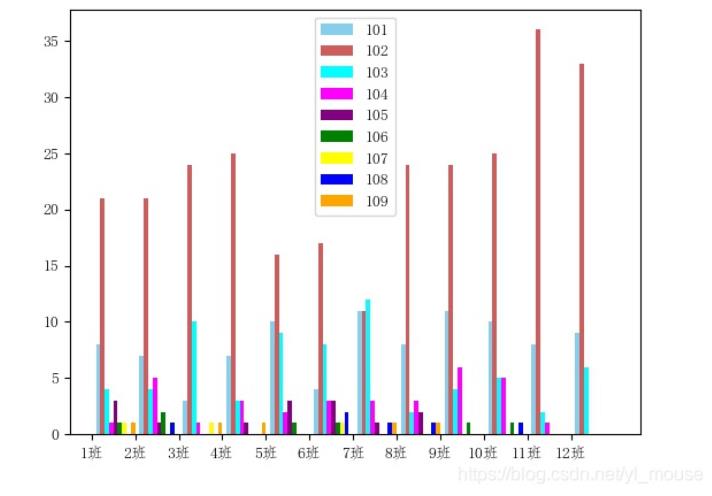
在做畢設的過程中有些數據用表格來展現,會很難看出數據之間的差別,凸顯不出數據的特點,所以想制作一個條形圖,這里特地記錄下,已備以后用到。
import numpy as np
import matplotlib.pyplot as plt
import matplotlib
#指定默認字體
matplotlib.rcParams['font.sans-serif'] = ['FangSong']
matplotlib.rcParams['font.family']='sans-serif'

c101= (8,7,3,7,10,4,11,8,11,10,8,9)
c102= (21,21,24,25,16,17,11,24,24,25,36,33)
c103= (4,4,10,3,9,8,12,2,4,5,2,6)
c104= (1,5,1,3,2,3,3,3,6,5,1,0)
c105= (3,1,0,1,3,3,1,2,0,0,0,0)
c106= (1,2,0,0,1,1,0,0,1,1,0,0)
c107= (1,0,1,0,0,1,0,0,0,0,0,0)
c108= (0,1,0,0,0,2,1,1,0,1,0,0)
c109= (1,0,1,1,0,0,1,1,0,0,0,0)

ind = np.arange(0,24,2) # the x locations for the groups
width = 0.2  # the width of the bars

fig,ax = plt.subplots()
rects1 = ax.bar(ind + width, c101, width, color='SkyBlue',align='edge', label='101')
rects2 = ax.bar(ind + 2*width, c102, width,color='IndianRed',align='edge', label='102')
rects3 = ax.bar(ind + 3*width, c103, width, color='Cyan',align='edge', label='103')
rects4 = ax.bar(ind + 4*width, c104, width, color='Magenta',align='edge', label='104')
rects5 = ax.bar(ind + 5*width, c105, width, color='Purple',align='edge', label='105')
rects6 = ax.bar(ind + 6*width, c106, width, color='Green',align='edge', label='106')
rects7 = ax.bar(ind + 7*width, c107, width, color='Yellow',align='edge', label='107')
rects8 = ax.bar(ind + 8*width, c108, width, color='Blue',align='edge', label='108')
rects9 = ax.bar(ind + 9*width, c109, width, color='Orange',align='edge', label='109')

# Add some text for labels, title and custom x-axis tick labels, etc.


#ax.set_title('Scores by group and gender')
plt.xticks(ind,('1班', '2班', '3班', '4班', '5班','6班','7班','8班','9班','10班','11班','12班'))
ax.legend(loc='upper center')

plt.show()
fig.savefig('./test77.jpg')
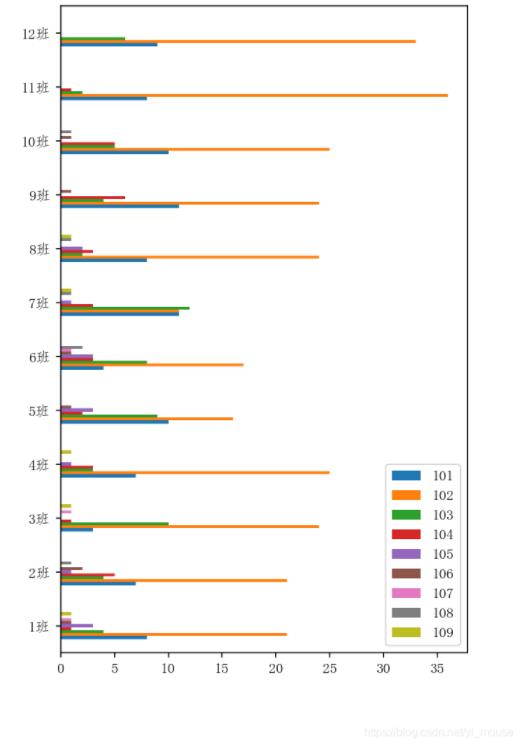
豎起來的
%matplotlib notebook
import matplotlib.pyplot as plt
import pandas as pd
import numpy as np
import seaborn as sns
import matplotlib
#指定默認字體
matplotlib.rcParams['font.sans-serif'] = ['FangSong']
matplotlib.rcParams['font.family']='sans-serif'
#解決負號'-'顯示為方塊的問題
matplotlib.rcParams['axes.unicode_minus'] = False
data = [[8, 21, 4, 1, 3, 1, 1, 0, 1],
        [7,21,4,5,1,2,0,1,0],
        [3,24,10,1,0,0,1,0,1],
        [7,25,3,3,1,0,0,0,1],
        [10,16,9,2,3,1,0,0,0],
        [4,17,8,3,3,1,1,2,0],
        [11,11,12,3,1,0,0,1,1],
        [8,24,2,3,2,0,0,1,1],
        [11,24,4,6,0,1,0,0,0],
        [10,25,5,5,0,1,0,1,0],
        [8,36,2,1,0,0,0,0],
        [9,33,6,0,0,0,0,0]]
df = pd.DataFrame(data,
                 index=['1班','2班','3班','4班','5班','6班','7班','8班','9班','10班','11班','12班'],
                 columns=pd.Index(['101','102','103','104','105','106','107','108','109']),
                 )


df.plot(kind='barh',figsize=(5,8))


plt.show()
#fig.savefig('./test2.jpg')
到此,關于“怎么用python畫條形圖”的學習就結束了,希望能夠解決大家的疑惑。理論與實踐的搭配能更好的幫助大家學習,快去試試吧!若想繼續學習更多相關知識,請繼續關注億速云網站,小編會繼續努力為大家帶來更多實用的文章!
免責聲明:本站發布的內容(圖片、視頻和文字)以原創、轉載和分享為主,文章觀點不代表本網站立場,如果涉及侵權請聯系站長郵箱:is@yisu.com進行舉報,并提供相關證據,一經查實,將立刻刪除涉嫌侵權內容。