您好,登錄后才能下訂單哦!
您好,登錄后才能下訂單哦!
小編給大家分享一下Python中matplotlib內置單顏色的示例分析,希望大家閱讀完這篇文章之后都有所收獲,下面讓我們一起去探討吧!
1.RGB 或者 RGBA 元組格式顏色
元組中浮點型數值位于 [0, 1] 之間,e.g(0.1, 0.2, 0.5) 或 (0.1, 0.2, 0.5, 0.3). RGA即Red, Green, Blue;RGBA即Red, Green, Blue, Alpha;
2.RGB or RGBA對應的hex 格式顏色
(e.g., '#0F0F0F' or '#0F0F0F0F');
3.[0,1]之間的任意浮點數
(e.g., '0.5'),其中0為純黑色,1為白色;
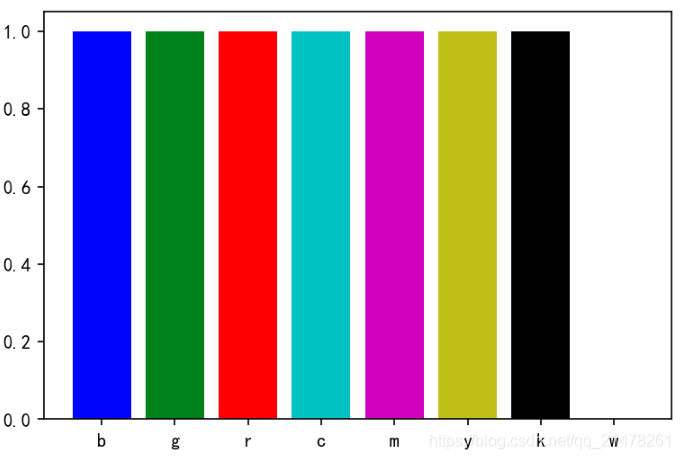
4.{'b', 'g', 'r', 'c', 'm', 'y', 'k', 'w'}幾種基本色;
5.X11/CSS4中的顏色
e.g. "blue";
6.xkcd中的顏色
e.g., 'purple (#7e1e9c)';
7.'Cn'格式顏色
matplotlib.rcParams['axes.prop_cycle']可輸出所有顏色,['#1f77b4', '#ff7f0e', '#2ca02c', '#d62728', '#9467bd', '#8c564b', '#e377c2', '#7f7f7f', '#bcbd22', '#17becf'],'C0'對應'#1f77b4',依次類推;
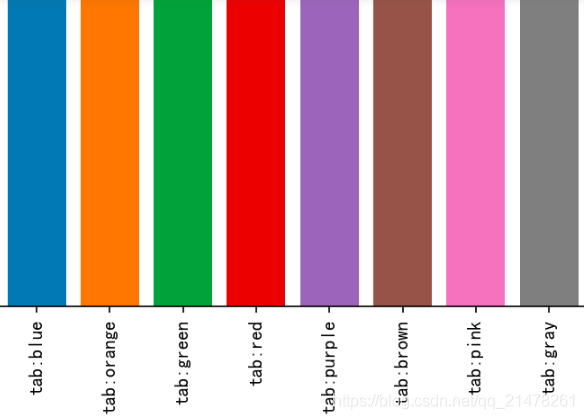
8.Tableau 的colormap中顏色
e.g. 'tab:blue';
#源自官網實例
import matplotlib.pyplot as plt
import numpy as np

t = np.linspace(0.0, 2.0, 201)
s = np.sin(2 * np.pi * t)

# 1) RGB tuple:
fig, ax = plt.subplots(facecolor=(.18, .31, .31),figsize=(10,5))
# 2) hex string:
ax.set_facecolor('#eafff5')
# 3) gray level string:
ax.set_title('Voltage vs. time chart', color='0.7')
# 4) single letter color string
ax.set_xlabel('time (s)', color='c')
# 5) a named color:
ax.set_ylabel('voltage (mV)', color='peachpuff')
# 6) a named xkcd color:
ax.plot(t, s, 'xkcd:crimson')
# 7) Cn notation:
ax.plot(t, .7*s, color='C4', linestyle='--')
# 8) tab notation:
ax.tick_params(labelcolor='tab:orange')
plt.show()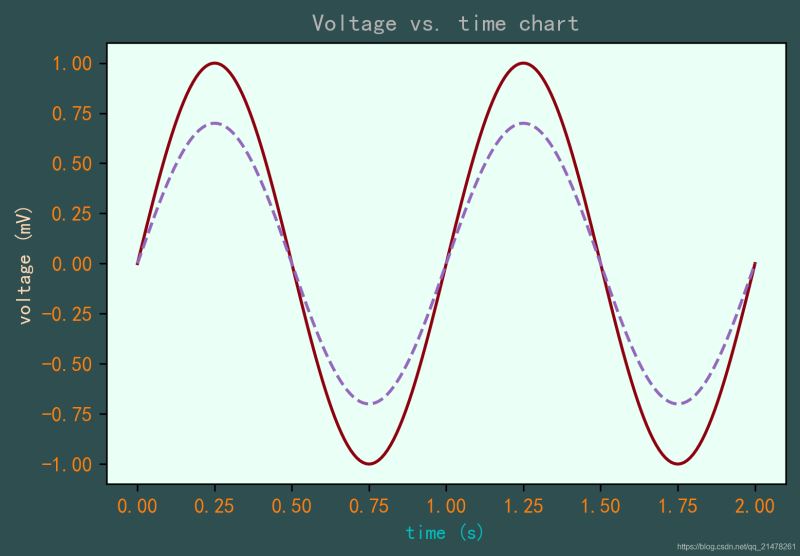
matplotlib內置的顏色可以使用matplotlib.colors 調用,有'BASE_COLORS','TABLEAU_COLORS','CSS4_COLORS'及 'XKCD_COLORS'四類。使用matplotlib.colors.類名稱可輸出顏色號。
b    (0, 0, 1)
g    (0, 0.5, 0)
r    (1, 0, 0)
c    (0, 0.75, 0.75)
m    (0.75, 0, 0.75)
y    (0.75, 0.75, 0)
k    (0, 0, 0)
w    (1, 1, 1)
tab:blue    #1f77b4
tab:orange    #ff7f0e
tab:green    #2ca02c
tab:red    #d62728
tab:purple    #9467bd
tab:brown    #8c564b
tab:pink    #e377c2
tab:gray    #7f7f7f
tab:olive    #bcbd22
tab:cyan    #17becf
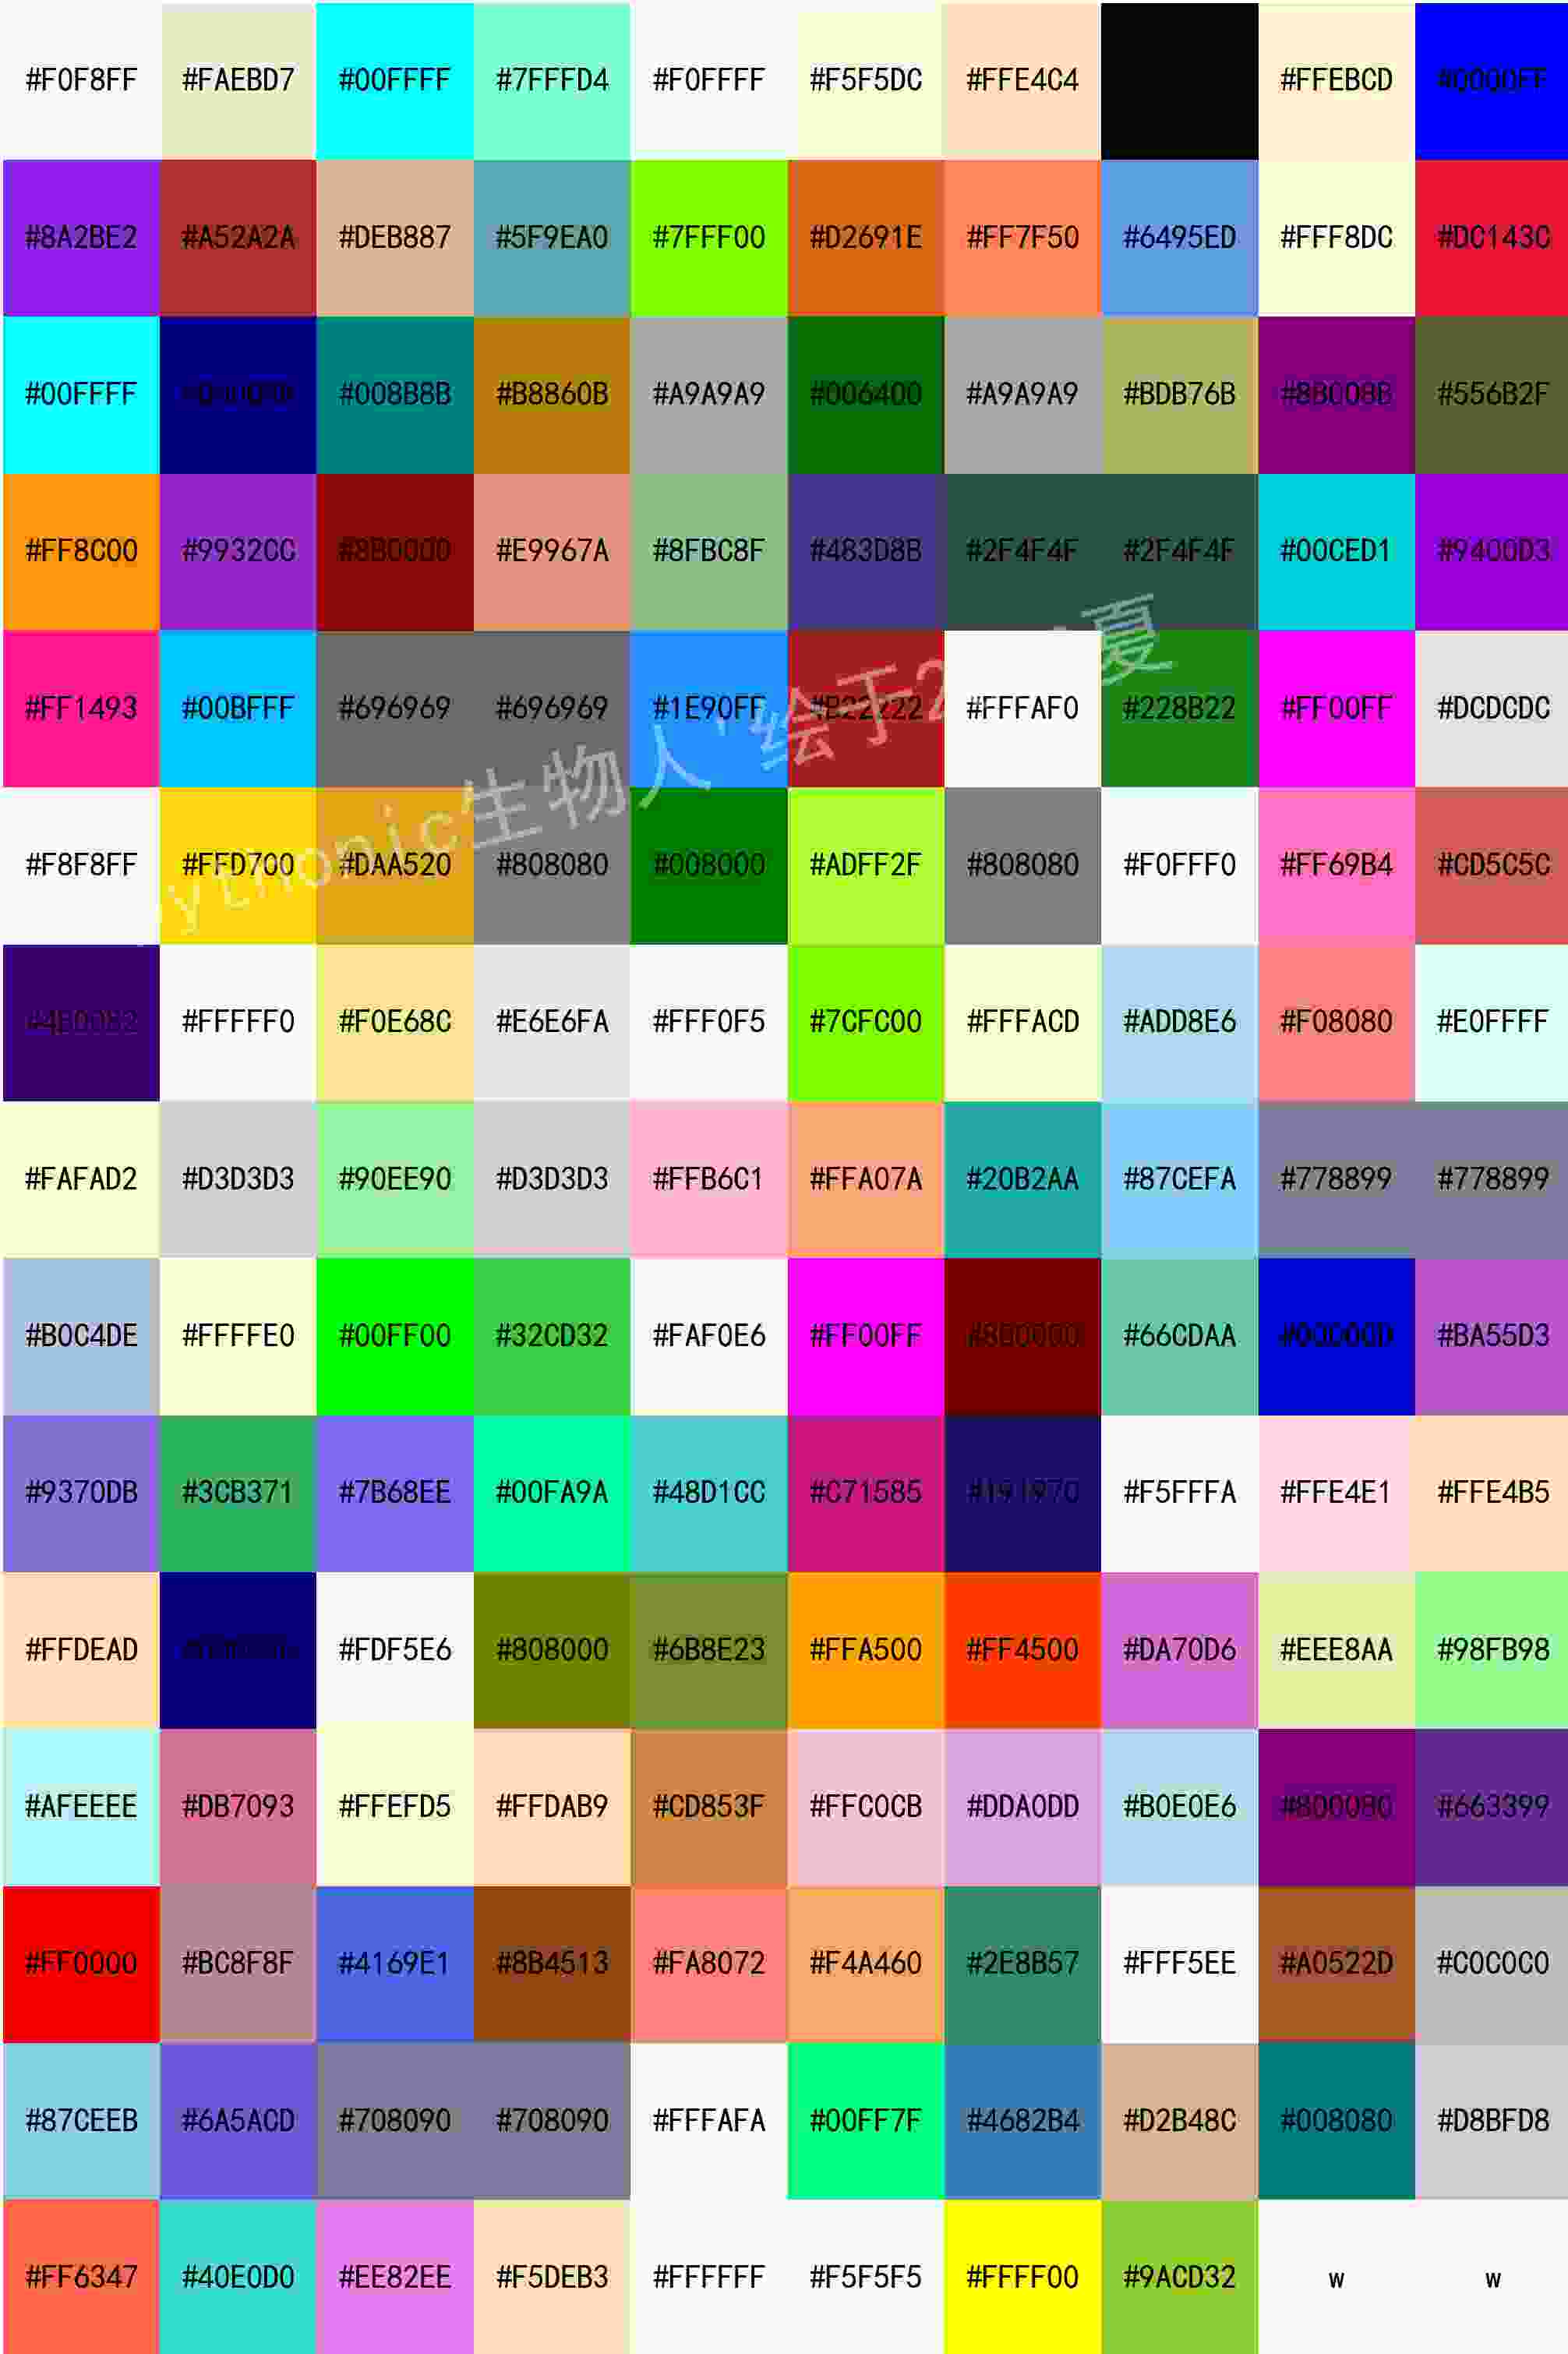
共計148種顏色。
顏色名稱    hex色號
aliceblue    #F0F8FF
antiquewhite    #FAEBD7
aqua    #00FFFF
aquamarine    #7FFFD4
azure    #F0FFFF
beige    #F5F5DC
bisque    #FFE4C4
black    #000000
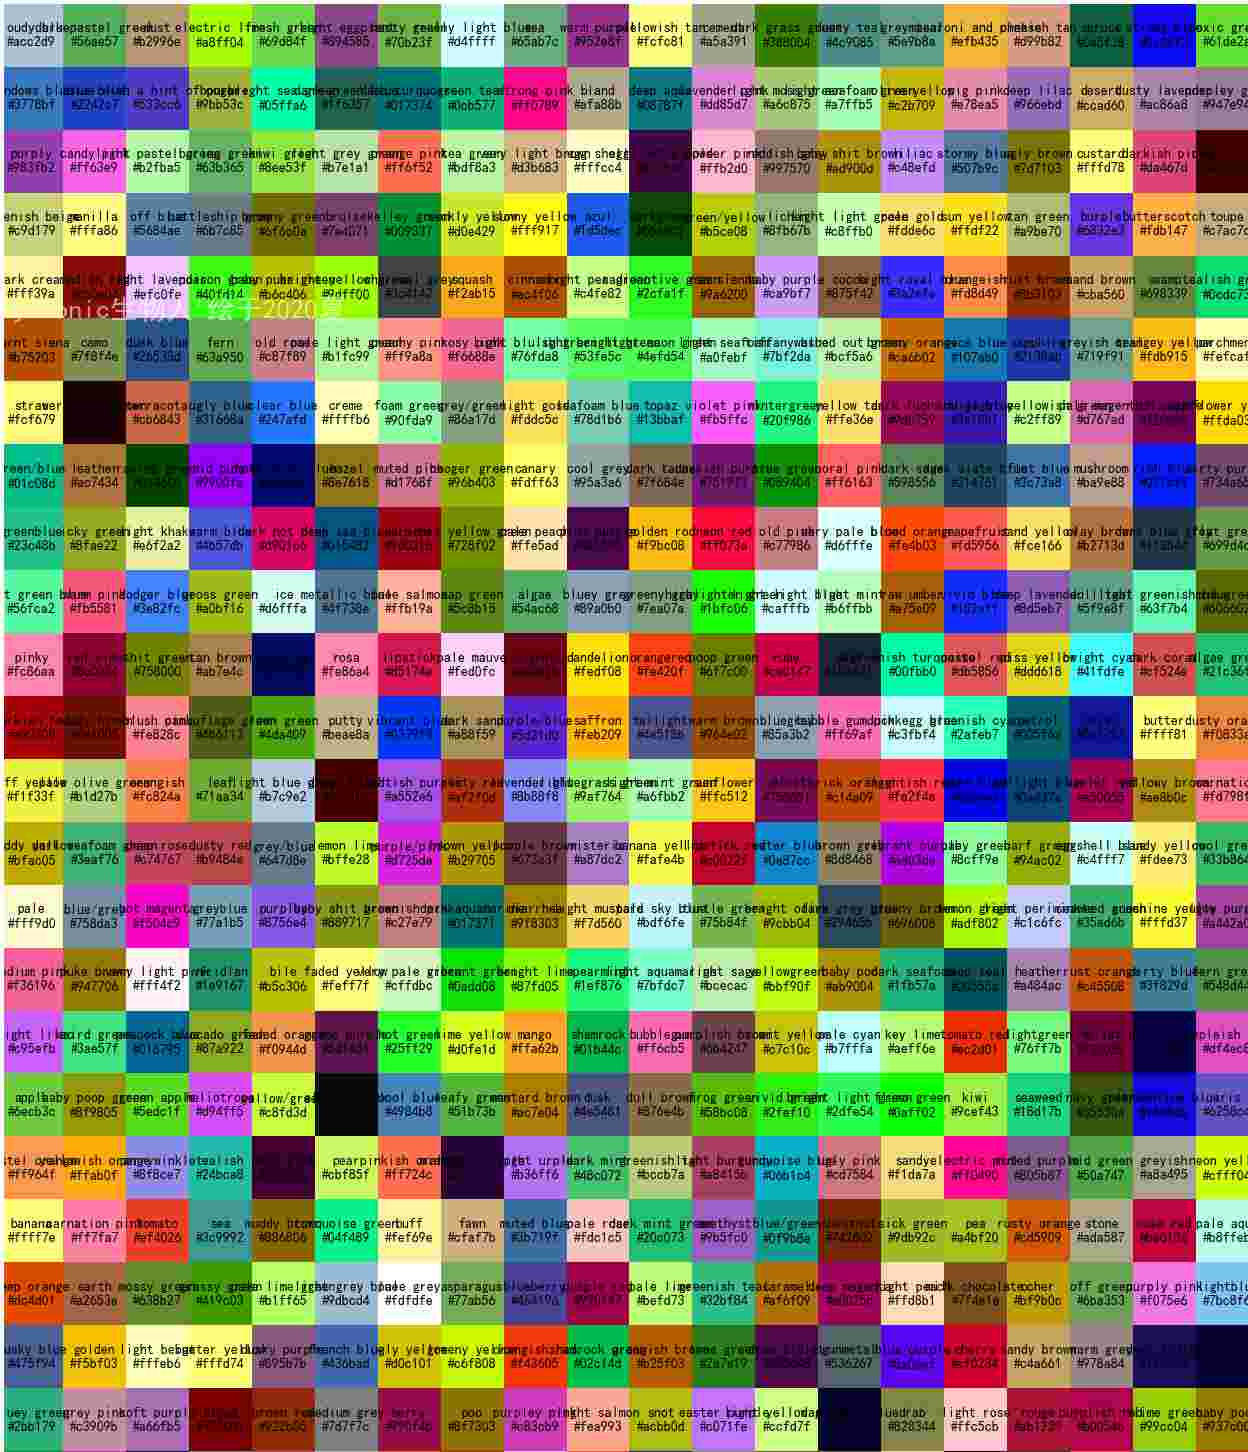
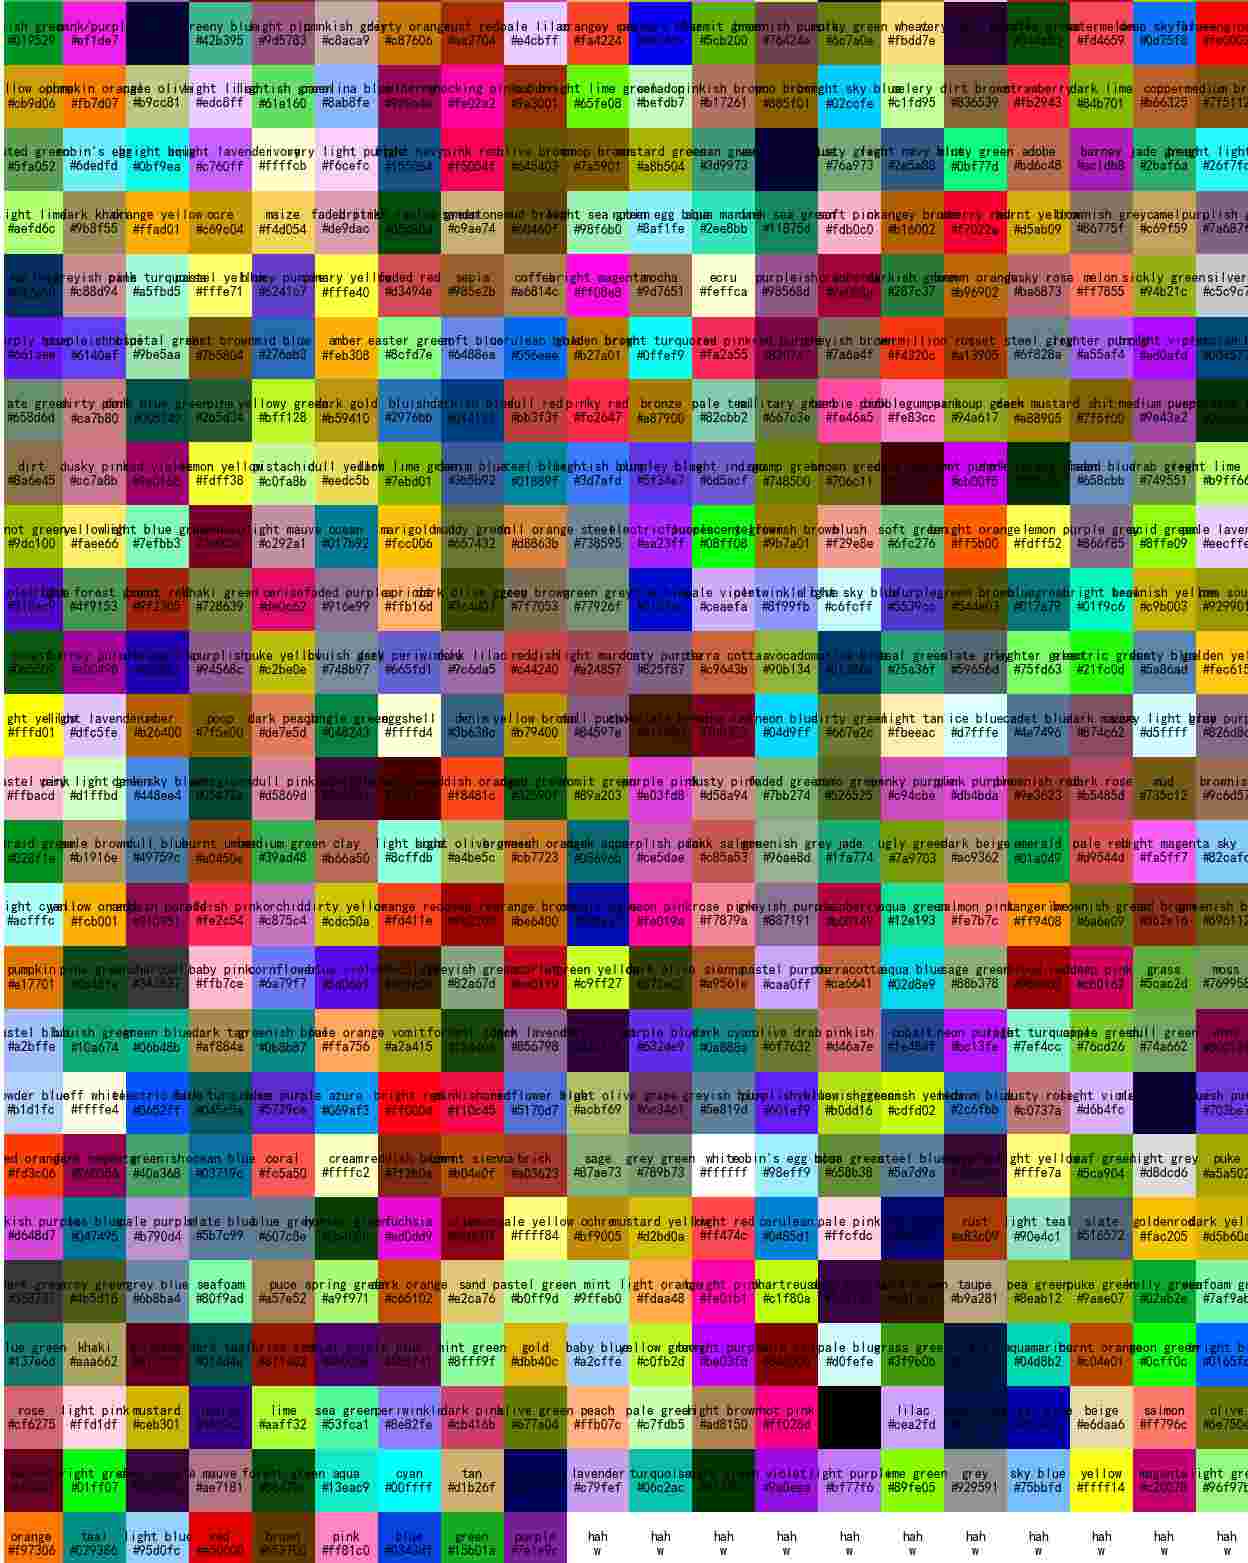
共計949種色號。
xkcd:cloudy blue    #acc2d9
xkcd:dark pastel green    #56ae57
xkcd:dust    #b2996e
xkcd:electric lime    #a8ff04
xkcd:fresh green    #69d84f
xkcd:light eggplant    #894585
xkcd:nasty green    #70b23f
xkcd:really light blue    #d4ffff
看完了這篇文章,相信你對“Python中matplotlib內置單顏色的示例分析”有了一定的了解,如果想了解更多相關知識,歡迎關注億速云行業資訊頻道,感謝各位的閱讀!
免責聲明:本站發布的內容(圖片、視頻和文字)以原創、轉載和分享為主,文章觀點不代表本網站立場,如果涉及侵權請聯系站長郵箱:is@yisu.com進行舉報,并提供相關證據,一經查實,將立刻刪除涉嫌侵權內容。