您好,登錄后才能下訂單哦!
您好,登錄后才能下訂單哦!
這篇文章主要介紹了 matplotlib如何實現text文字處理 ,具有一定借鑒價值,感興趣的朋友可以參考下,希望大家閱讀完這篇文章之后大有收獲,下面讓小編帶著大家一起了解一下。
1.4.處理文字
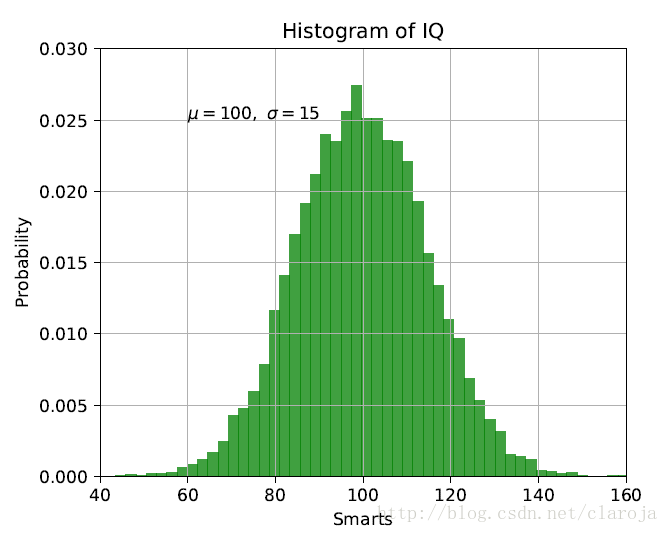
text()命令可以在任意的位置添加文字,xlabel(),ylabel(),title()分別是添加x軸,y軸標簽和標題。
import numpy as npimport matplotlib.pyplot as plt# Fixing random state for reproducibilitynp.random.seed(19680801)
mu, sigma = 100, 15x = mu + sigma * np.random.randn(10000)# the histogram of the datan, bins, patches = plt.hist(x, 50, normed=1, facecolor='g', alpha=0.75)
plt.xlabel('Smarts')
plt.ylabel('Probability')
plt.title('Histogram of IQ')
plt.text(60, .025, r'$\mu=100,\ \sigma=15$')
plt.axis([40, 160, 0, 0.03])
plt.grid(True)
plt.show()
所有的text()命令會返回一個matplotlib.text.Text實例,通過屬性或者setp()來改變他們。
t = plt.xlabel(‘my data’, fontsize=14, color=’red’)
1.4.1 使用數學表達式
plt.title(r'$\sigma_i=15$')
前置的r是指定它后面的字符串是原始的字符串,然后用$包裹表示中間的是數學表達式,\表示轉譯具體的數學符號。
4.2 注釋
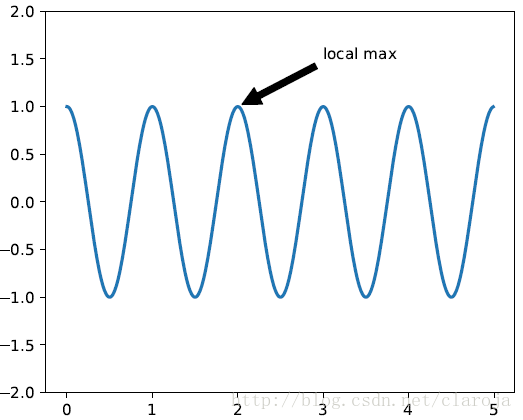
annotate()方法提供了一個注釋的方法。
annotate(string,xy,xytest,arrowprops)
import numpy as np
import matplotlib.pyplot as plt
ax = plt.subplot(111)
t = np.arange(0.0, 5.0, 0.01)
s = np.cos(2*np.pi*t)line, = plt.plot(t, s, lw=2)
plt.annotate('local max', xy=(2, 1), xytext=(3, 1.5),
arrowprops=dict(facecolor='black', shrink=0.05),
)
plt.ylim(-2,2)
plt.show()
默認的情況下,xy和xytext使用的坐標是數據的坐標,你也可以指定其他的坐標系統。
感謝你能夠認真閱讀完這篇文章,希望小編分享的“ matplotlib如何實現text文字處理 ”這篇文章對大家有幫助,同時也希望大家多多支持億速云,關注億速云行業資訊頻道,更多相關知識等著你來學習!
免責聲明:本站發布的內容(圖片、視頻和文字)以原創、轉載和分享為主,文章觀點不代表本網站立場,如果涉及侵權請聯系站長郵箱:is@yisu.com進行舉報,并提供相關證據,一經查實,將立刻刪除涉嫌侵權內容。