溫馨提示×
您好,登錄后才能下訂單哦!
點擊 登錄注冊 即表示同意《億速云用戶服務條款》
您好,登錄后才能下訂單哦!
這期內容當中小編將會給大家帶來有關如何使用R語言ggplot2進行圖例去掉灰色背景、添加橢圓和圓形分組邊界,文章內容豐富且以專業的角度為大家分析和敘述,閱讀完這篇文章希望大家可以有所收獲。
示例數據就直接用內置的鳶尾花的數據集了
library(ggplot2)
colnames(iris)
ggplot(iris,aes(x=Sepal.Length,y=Sepal.Width))+
  geom_point(aes(size=Petal.Length,color=Species))+
  guides(color=F)+
  scale_size_continuous(range = c(5,10),
                        breaks = c(2,4,6))
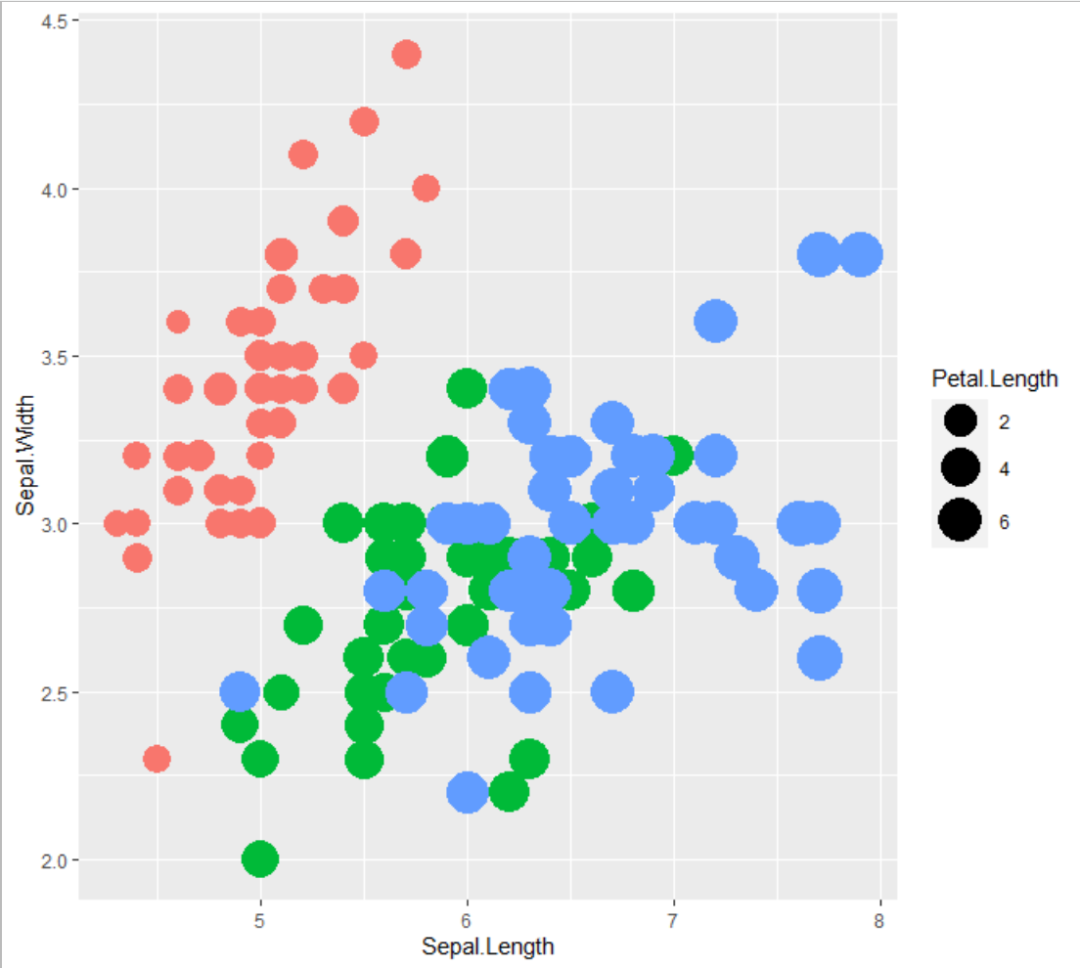
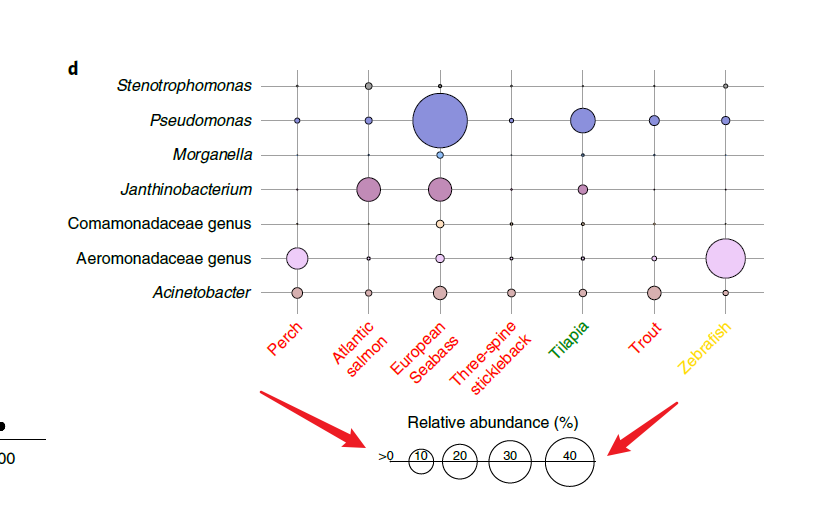
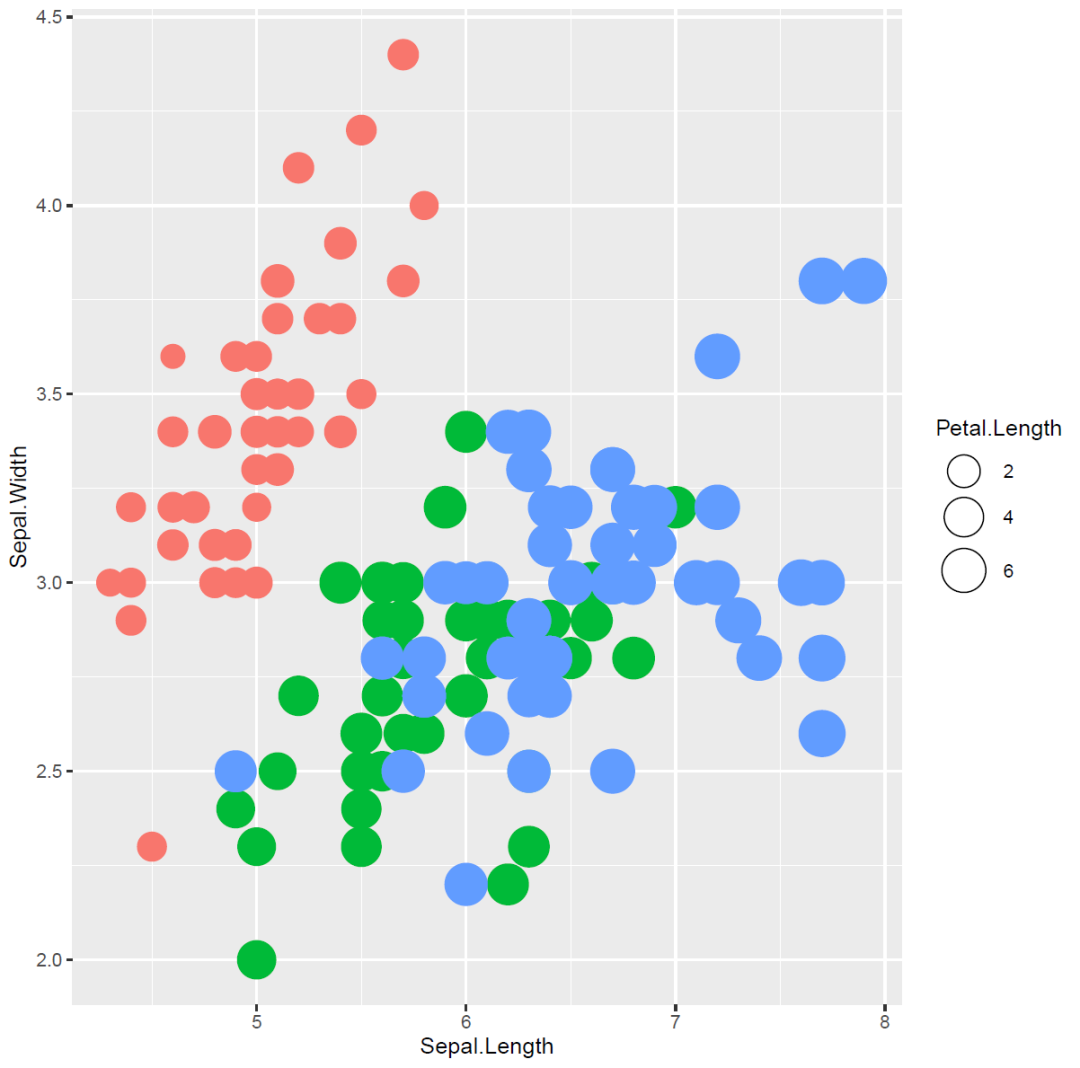
我開始想復雜了,以為需要去圖例相關的參數里進行設置,原來直接更改點的形狀就好了,給shape參數設置成21就好了
ggplot(iris,aes(x=Sepal.Length,y=Sepal.Width))+
  geom_point(aes(size=Petal.Length,color=Species),
             shape=21)+
  guides(color=F)+
  scale_size_continuous(range = c(5,10),
                        breaks = c(2,4,6))
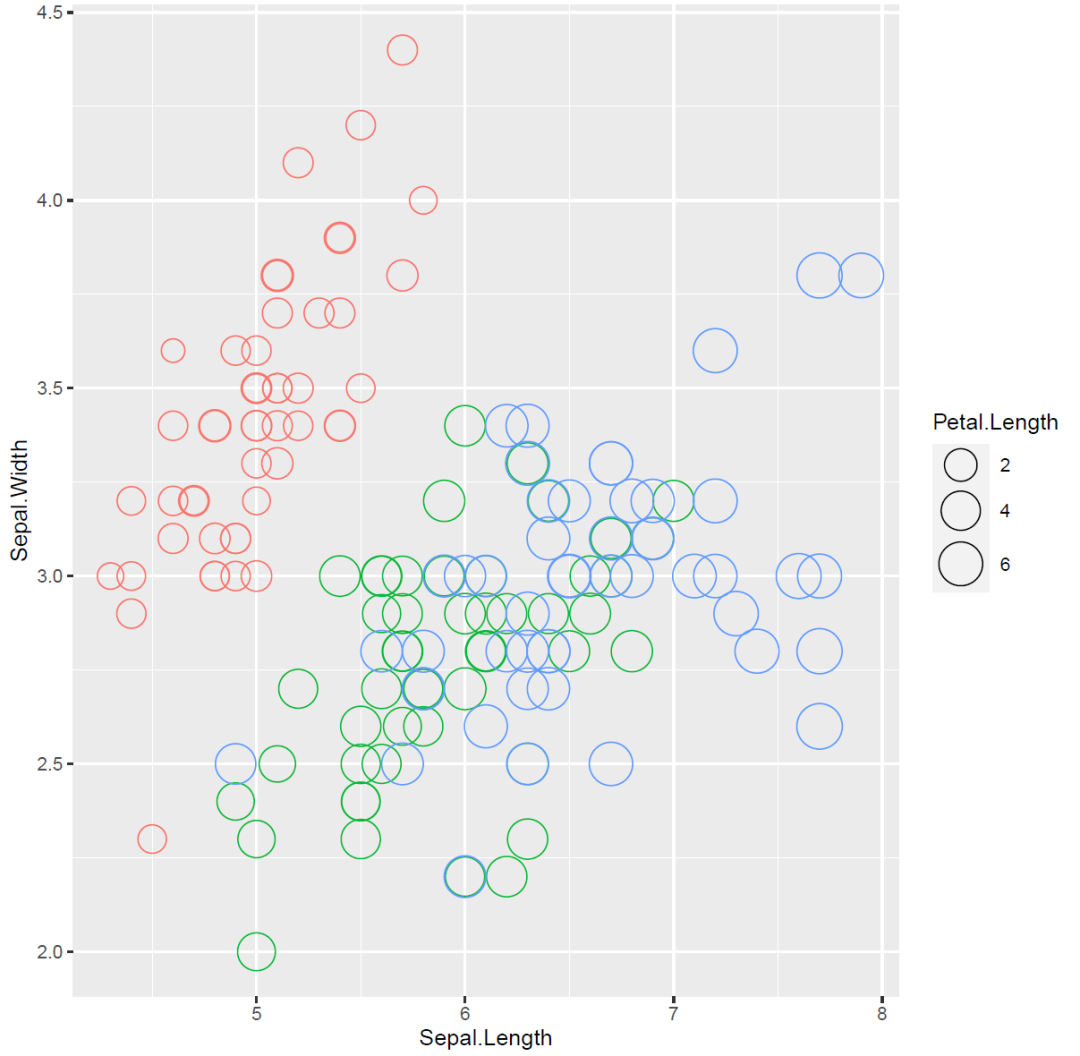
這樣的話圖上的點也都變成空心的了,如果想把圖上的點設置成實心的,就再增加一個fill參數就好了
ggplot(iris,aes(x=Sepal.Length,y=Sepal.Width))+
  geom_point(aes(size=Petal.Length,
                 color=Species,
                 fill=Species),
             shape=21)+
  guides(color=F,fill=F)+
  scale_size_continuous(range = c(5,10),
                        breaks = c(2,4,6))
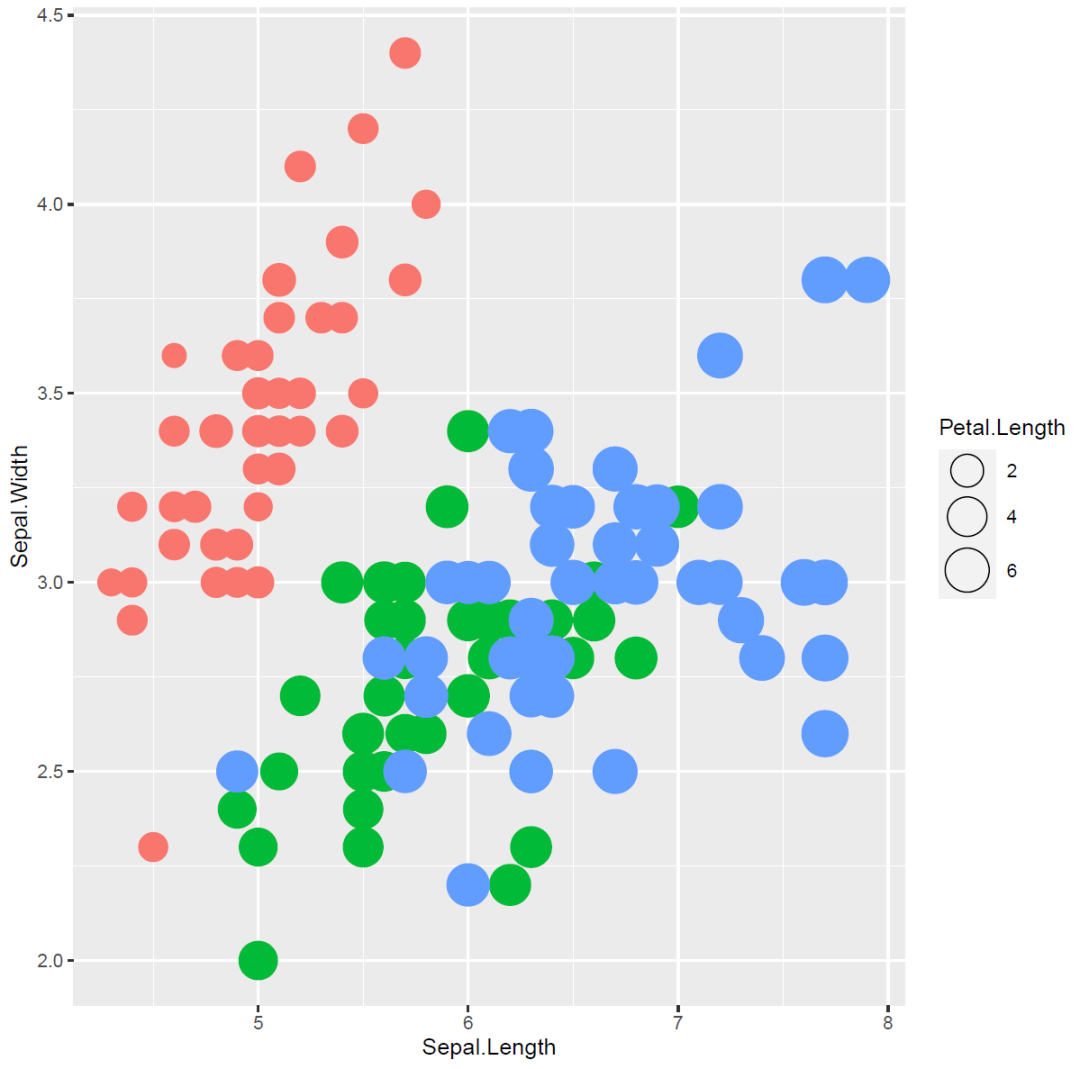
這里還可以看到圖例是帶灰色背景的,如果想要去掉怎么辦呢?答案是在主題里設置
legend.key參數
ggplot(iris,aes(x=Sepal.Length,y=Sepal.Width))+
  geom_point(aes(size=Petal.Length,
                 color=Species,
                 fill=Species),
             shape=21)+
  guides(color=F,fill=F)+
  scale_size_continuous(range = c(5,10),
                        breaks = c(2,4,6))+
  theme(legend.key = element_blank())
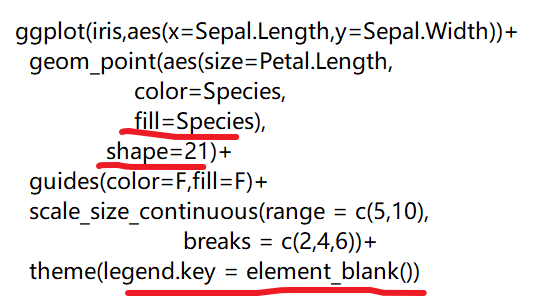
這里的key對應的中文意思是什么呢?
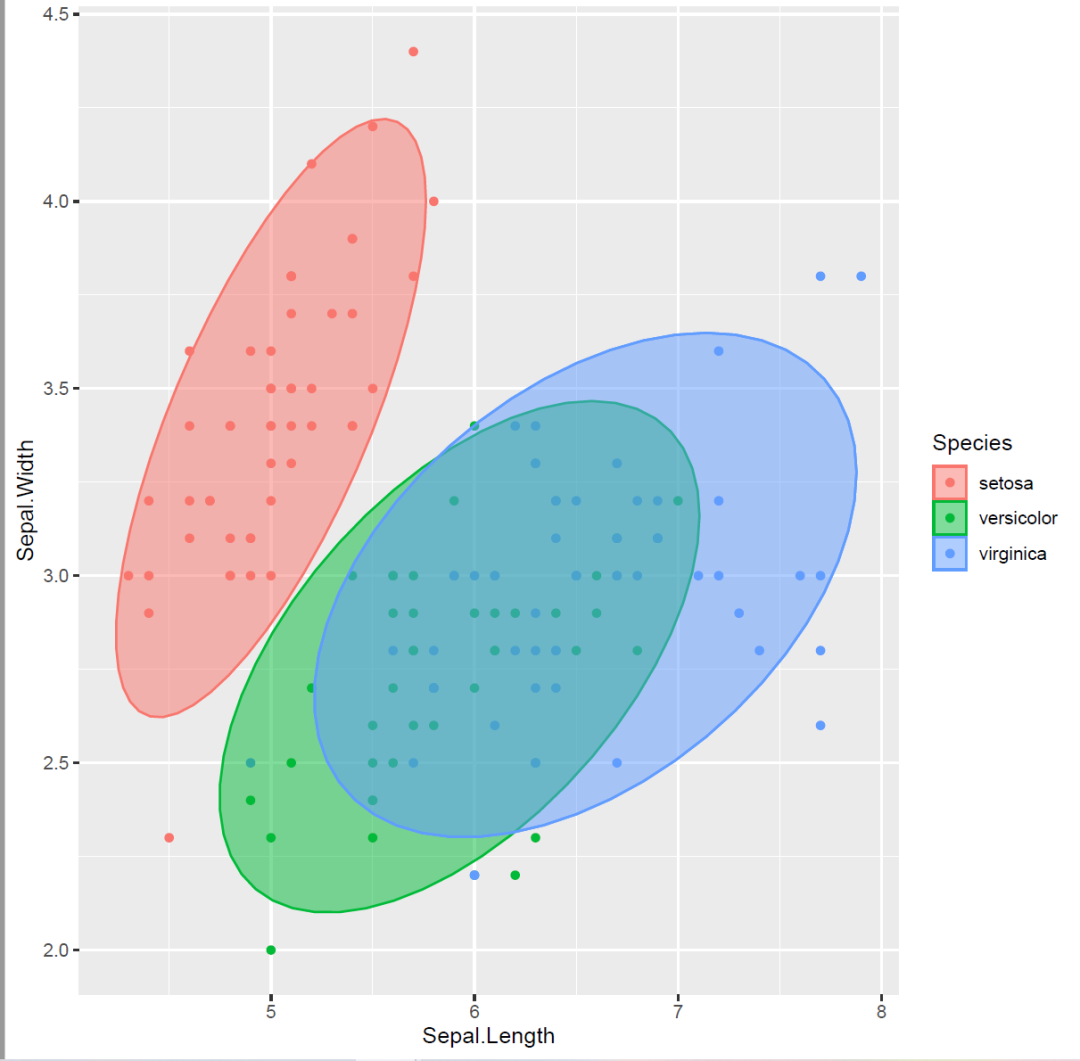
用到的是stat_ellipse()函數
ggplot(data=iris,aes(x=Sepal.Length,
                     y=Sepal.Width,
                     color=Species))+
  geom_point()+
  theme(legend.key = element_blank())+
  stat_ellipse(aes(x=Sepal.Length,
                   y=Sepal.Width,
                   color=Species,
                   fill=Species),
                   geom = "polygon",
                   alpha=0.5)
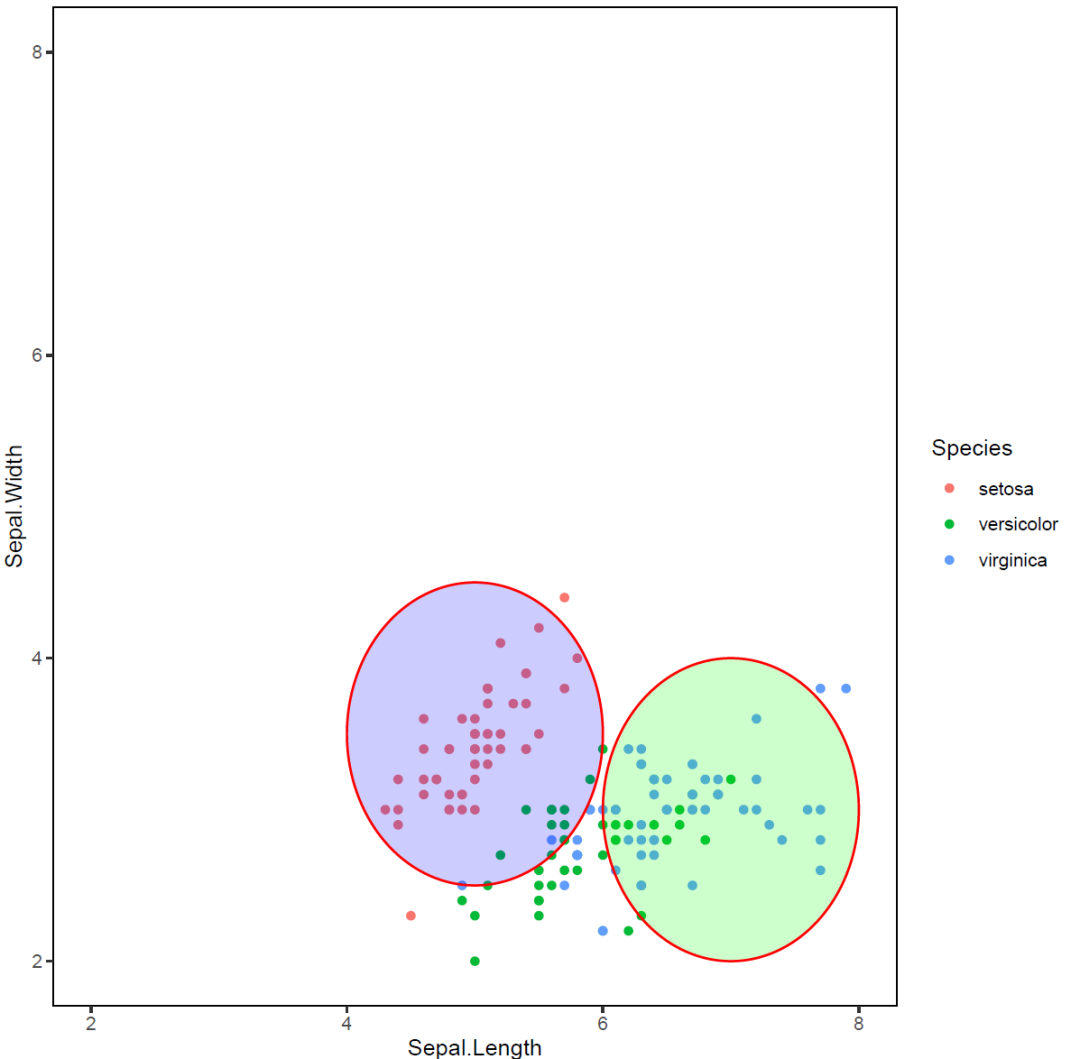
用到的是ggforce這個包里的geom_circle()函數
library(ggplot2)
library(ggforce)
colnames(iris)
ggplot()+
  geom_point(data=iris,aes(x=Sepal.Length,
                           y=Sepal.Width,
                           color=Species))+
  theme(legend.key = element_blank(),
        panel.background = element_blank(),
        panel.border = element_rect(color="black",
                                    fill = "transparent"))+
  geom_circle(aes(x0=5,y0=3.5,r=1),
              fill="blue",
              alpha=0.2,
              color="red")+
  xlim(2,8)+
  ylim(2,8)+
  geom_circle(aes(x0=7,y0=3,r=1),
              fill="green",
              alpha=0.2,
              color="red")
上述就是小編為大家分享的如何使用R語言ggplot2進行圖例去掉灰色背景、添加橢圓和圓形分組邊界了,如果剛好有類似的疑惑,不妨參照上述分析進行理解。如果想知道更多相關知識,歡迎關注億速云行業資訊頻道。
免責聲明:本站發布的內容(圖片、視頻和文字)以原創、轉載和分享為主,文章觀點不代表本網站立場,如果涉及侵權請聯系站長郵箱:is@yisu.com進行舉報,并提供相關證據,一經查實,將立刻刪除涉嫌侵權內容。