您好,登錄后才能下訂單哦!
您好,登錄后才能下訂單哦!
今天就跟大家聊聊有關使用OpenLayers3如何實現測量功能,可能很多人都不太了解,為了讓大家更加了解,小編給大家總結了以下內容,希望大家根據這篇文章可以有所收獲。
1. 前言
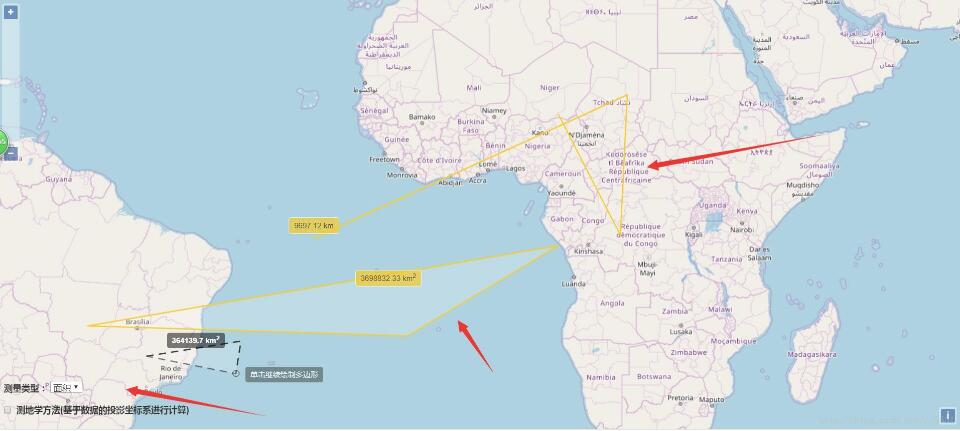
測量功能實現面積的測量以及長度的測量。通過鼠標繪制區域以及長度來進行測量。OpenLayers 3 框架沒有提供測量控件,但提供了相應的接口,需要需要基于幾何對象的相應接口,結合圖形繪制功能實現。
2. 實現思路
(1)新建一個網頁,引用 openlayers 3 開發庫、jQuery 庫與 bootstrap 庫,并參照前面顯示地圖的文章,加載 OSM 瓦片圖層。
(2)在地圖容器中,創建一個測量類型選擇控件,進行選擇距離測量與面積測量。
(3)編寫代碼實現測量功能。
3. 實現代碼
html主要代碼
<div id="map">
    <div id="menu">
      <label>測量類型:</label>
      <select id="type">
      <option value="length">長度</option>
      <option value="area">面積</option>
    </select>
      <label class="checkbox"><input type="checkbox" id="geodesic">使用大地測量</label>
    </div>
</div>
測量類型控件的樣式設置:
#menu {
      float: left;
      position: absolute;
      bottom: 10px;
      left: 10px;
      z-index: 2000;
    }

    .checkbox {
      left: 20px;
    }
    /* 提示框的樣式信息 */

    .tooltip {
      position: relative;
      background: rgba(0, 0, 0, 0.5);
      border-radius: 4px;
      color: white;
      padding: 4px 8px;
      opacity: 0.7;
      white-space: nowrap;
    }

    .tooltip-measure {
      opacity: 1;
      font-weight: bold;
    }

    .tooltip-static {
      background-color: #ffcc33;
      color: black;
      border: 1px solid white;
    }

    .tooltip-measure::before,
    .tooltip-static::before {
      border-top: 6px solid rgb(0, 0, 0, 0.5);
      border-right: 6px solid transparent;
      border-left: 6px solid transparent;
      content: "";
      position: absolute;
      bottom: -6px;
      margin-left: -7px;
      left: 50%;
    }

    .tooltip-static::before {
      border-top-color: #ffcc33;
}
代碼解析
上面的代碼是結合 bootstrap庫,使用冒泡提示框形式顯示當前的測量結果,上面的樣式分別設置了兩種提示框的樣式。
4. 實現測量功能的核心代碼
(1)首先在地圖上加載測量功能的繪制層,即矢量圖層,就相當于,我們畫畫,需要紙來進行繪畫,這里的矢量圖層,相當于我們的紙。代碼如下:
//加載測量的繪制矢量層
var source = new ol.source.Vector(); //圖層數據源
var vector = new ol.layer.Vector({
  source: source,
  style: new ol.style.Style({ //圖層樣式
   fill: new ol.style.Fill({
    color: 'rgba(255, 255, 255, 0.2)' //填充顏色
   }),
   stroke: new ol.style.Stroke({
    color: '#ffcc33', //邊框顏色
    width: 2 // 邊框寬度
   }),
   image: new ol.style.Circle({
    radius: 7,
    fill: new ol.style.Fill({
     color: '#ffcc33'
    })
   })
  })
 });
map.addLayer(vector);
(2)通過 addInteraction 方法實現測量功能,首先加載交互繪圖控件(ol.interaction.Draw),也就是我們前面所說的畫畫需要的筆,在測量時根據測量類型選擇繪制線段或多邊形,然后分別為交互繪圖控件綁定 drawstart 與 drawend 事件。在繪圖開始時實時計算當前當前繪制線的長度或多邊形的面積,以提示框形式顯示,繪圖結束時重新創建一個測量提示框顯示測量結果。通過 addInteraction 函數實現繪圖測量的代碼:
4.1 addInteraction 函數實現繪圖測量的代碼:
/**
  * 切換選擇測量類型(長度或面積)
  * @param {Event} e Change event.
  */
 typeSelect.onchange = function(e) {
  map.removeInteraction(draw); //移除繪制圖形
  addInteraction(); //添加繪圖進行測量
 };
addInteraction(); //調用加載繪制交互控件的方法,添加繪圖進行測量
addInteraction()函數代碼:
var geodesicCheckbox = document.getElementById('geodesic'); //測地學方式對象
var typeSelect = document.getElementById('type'); //測量類型對象
var draw; // global so we can remove it later
/**
 * 加載交互繪制控件函數
 */
function addInteraction() {
 var type = (typeSelect.value == 'area' ? 'Polygon' : 'LineString');
 draw = new ol.interaction.Draw({
  source: source, //測量繪制層數據源
  type: /** @type {ol.geom.GeometryType} */ (type), //幾何圖形類型
  style: new ol.style.Style({ //繪制幾何圖形的樣式
   fill: new ol.style.Fill({
    color: 'rgba(255, 255, 255, 0.2)'
   }),
   stroke: new ol.style.Stroke({
    color: 'rgba(0, 0, 0, 0.5)',
    lineDash: [10, 10],
    width: 2
   }),
   image: new ol.style.Circle({
    radius: 5,
    stroke: new ol.style.Stroke({
     color: 'rgba(0, 0, 0, 0.7)'
    }),
    fill: new ol.style.Fill({
     color: 'rgba(255, 255, 255, 0.2)'
    })
   })
  })
 });
 map.addInteraction(draw);

 createMeasureTooltip(); //創建測量工具提示框
 createHelpTooltip(); //創建幫助提示框

 var listener;
 //綁定交互繪制工具開始繪制的事件
 draw.on('drawstart',
  function(evt) {
   // set sketch
   sketch = evt.feature; //繪制的要素

   /** @type {ol.Coordinate|undefined} */
   var tooltipCoord = evt.coordinate; // 繪制的坐標
   //綁定change事件,根據繪制幾何類型得到測量長度值或面積值,并將其設置到測量工具提示框中顯示
   listener = sketch.getGeometry().on('change', function(evt) {
    var geom = evt.target; //繪制幾何要素
    var output;
    if (geom instanceof ol.geom.Polygon) {
     output = formatArea( /** @type {ol.geom.Polygon} */ (geom)); //面積值
     tooltipCoord = geom.getInteriorPoint().getCoordinates(); //坐標
    } else if (geom instanceof ol.geom.LineString) {
     output = formatLength( /** @type {ol.geom.LineString} */ (geom)); //長度值
     tooltipCoord = geom.getLastCoordinate(); //坐標
    }
    measureTooltipElement.innerHTML = output; //將測量值設置到測量工具提示框中顯示
    measureTooltip.setPosition(tooltipCoord); //設置測量工具提示框的顯示位置
   });
  }, this);
 //綁定交互繪制工具結束繪制的事件
 draw.on('drawend',
  function(evt) {
   measureTooltipElement.className = 'tooltip tooltip-static'; //設置測量提示框的樣式
   measureTooltip.setOffset([0, -7]);
   // unset sketch
   sketch = null; //置空當前繪制的要素對象
   // unset tooltip so that a new one can be created
   measureTooltipElement = null; //置空測量工具提示框對象
   createMeasureTooltip(); //重新創建一個測試工具提示框顯示結果
   ol.Observable.unByKey(listener);
  }, this);
}
代碼解析
首先加載繪圖控件(ol.interaction.Draw),也就是我們的筆,在實例化控件時設置當前繪圖要素的樣式,然后分別調用 createHelpTooltop() 與 createMeasureTooltip() 創建幫助信息提示框和測量工具提示框對象;最后綁定繪圖控件對象的 drawstart 與 drawend 事件,實現繪圖測量功能。其中,在drawstart 事件處理函數中, 由事件對象得到當前繪制的要素(sketch),通過繪制要素的幾何對象綁定 change 事件,根據事件監聽的幾何對象類型是線或是多邊形(ol.geom.Polygon 或 ol.geom.LineString),調用 formatArea() 與 formatLength() 計算輸出測量得到的面積值或長度值。
4.2 創建提示框的代碼:
/**
  *創建一個新的幫助提示框(tooltip)
  */
 function createHelpTooltip() {
  if (helpTooltipElement) {
   helpTooltipElement.parentNode.removeChild(helpTooltipElement);
  }
  helpTooltipElement = document.createElement('div');
  helpTooltipElement.className = 'tooltip hidden';
  helpTooltip = new ol.Overlay({
   element: helpTooltipElement,
   offset: [15, 0],
   positioning: 'center-left'
  });
  map.addOverlay(helpTooltip);
 }
 /**
  *創建一個新的測量工具提示框(tooltip)
  */
 function createMeasureTooltip() {
  if (measureTooltipElement) {
   measureTooltipElement.parentNode.removeChild(measureTooltipElement);
  }
  measureTooltipElement = document.createElement('div');
  measureTooltipElement.className = 'tooltip tooltip-measure';
  measureTooltip = new ol.Overlay({
   element: measureTooltipElement,
   offset: [0, -15],
   positioning: 'bottom-center'
  });
  map.addOverlay(measureTooltip);
}
代碼解析
基于Openlayers 3 的 ol.Overlay 實現創建幫助信息提示框和測量工具提示框,分別通過 createHelpTooltip() 與 createMeasureTooltip() 創建幫助信息提示框和測量工具提示框, ol.Overlay j就是動態創建疊加層對象與其目標容器(div層),并將疊加層對象添加到地圖容器中。
4.3 計算長度與面積的代碼:
/**
  * 測量長度輸出
  * @param {ol.geom.LineString} line
  * @return {string}
  */
 var formatLength = function(line) {
  var length;
  if (geodesicCheckbox.checked) { //若使用測地學方法測量
   var coordinates = line.getCoordinates(); //解析線的坐標
   length = 0;
   var sourceProj = map.getView().getProjection(); //地圖數據源投影坐標系
   //通過遍歷坐標計算兩點之前距離,進而得到整條線的長度
   for (var i = 0, ii = coordinates.length - 1; i < ii; ++i) {
    var c1 = ol.proj.transform(coordinates[i], sourceProj, 'EPSG:4326');
    var c2 = ol.proj.transform(coordinates[i + 1], sourceProj, 'EPSG:4326');
    length += wgs84Sphere.haversineDistance(c1, c2);
   }
  } else {
   length = Math.round(line.getLength() * 100) / 100; //直接得到線的長度
  }
  var output;
  if (length > 100) {
   output = (Math.round(length / 1000 * 100) / 100) + ' ' + 'km'; //換算成KM單位
  } else {
   output = (Math.round(length * 100) / 100) + ' ' + 'm'; //m為單位
  }
  return output; //返回線的長度
 };
 /**
  * 測量面積輸出
  * @param {ol.geom.Polygon} polygon
  * @return {string}
  */
 var formatArea = function(polygon) {
  var area;
  if (geodesicCheckbox.checked) { //若使用測地學方法測量
   var sourceProj = map.getView().getProjection(); //地圖數據源投影坐標系
   var geom = /** @type {ol.geom.Polygon} */ (polygon.clone().transform(sourceProj, 'EPSG:4326')); //將多邊形要素坐標系投影為EPSG:4326
   var coordinates = geom.getLinearRing(0).getCoordinates(); //解析多邊形的坐標值
   area = Math.abs(wgs84Sphere.geodesicArea(coordinates)); //獲取面積
  } else {
   area = polygon.getArea(); //直接獲取多邊形的面積
  }
  var output;
  if (area > 10000) {
   output = (Math.round(area / 1000000 * 100) / 100) + ' ' + 'km<sup>2</sup>'; //換算成KM單位
  } else {
   output = (Math.round(area * 100) / 100) + ' ' + 'm<sup>2</sup>'; //m為單位
  }
  return output; //返回多邊形的面積
 };

addInteraction(); //調用加載繪制交互控件方法,添加繪圖進行測量
代碼解析
上面代碼通過 formatLength() 與 formatArea() 分別計算輸出的長度值以及面積值。計算長度值或者面積值時可以通過兩種方法進行計算,一種是使用測地學的方法基于數據的投影坐標系進行計算,另一種是調用幾何對象或者多邊形對象的方法直接獲取值。
(3)開始畫畫了,分別使用map對象綁定鼠標移動事件(pointermove)和鼠標移除事件(mouseout)。
4.4 添加地圖鼠標移動事件的代碼:
 /**
  * 當用戶正在繪制多邊形時的提示信息文本
  * @type {string}
  */
 var continuePolygonMsg = '單擊繼續繪制多邊形';
 /**
  * 當用戶正在繪制線時的提示信息文本
  * @type {string}
  */
 var continueLineMsg = '單擊繼續繪制線';

 /**
  * 鼠標移動事件處理函數
  * @param {ol.MapBrowserEvent} evt
  */
 var pointerMoveHandler = function(evt) {
  if (evt.dragging) {
   return;
  }
  /** @type {string} */
  var helpMsg = '開始繪制'; //當前默認提示信息
  //判斷繪制幾何類型設置相應的幫助提示信息
  if (sketch) {
   var geom = (sketch.getGeometry());
   if (geom instanceof ol.geom.Polygon) {
    helpMsg = continuePolygonMsg; //繪制多邊形時提示相應內容
   } else if (geom instanceof ol.geom.LineString) {
    helpMsg = continueLineMsg; //繪制線時提示相應內容
   }
  }
  helpTooltipElement.innerHTML = helpMsg; //將提示信息設置到對話框中顯示
  helpTooltip.setPosition(evt.coordinate); //設置幫助提示框的位置
  $(helpTooltipElement).removeClass('hidden'); //移除幫助提示框的隱藏樣式進行顯示
 };
 map.on('pointermove', pointerMoveHandler); //地圖容器綁定鼠標移動事件,動態顯示幫助提示框內容
 //地圖綁定鼠標移出事件,鼠標移出時為幫助提示框設置隱藏樣式
 $(map.getViewport()).on('mouseout', function() {
  $(helpTooltipElement).addClass('hidden');
});
代碼解析
鼠標移動事件(pointermove),在回調函數中,根據用戶選擇測量的類型,在彈窗中顯示幫助提示信息,同時為地圖容器綁定鼠標移除事件(mouseout),該事件發生后影藏提示框。
5. 實現效果

看完上述內容,你們對使用OpenLayers3如何實現測量功能有進一步的了解嗎?如果還想了解更多知識或者相關內容,請關注億速云行業資訊頻道,感謝大家的支持。
免責聲明:本站發布的內容(圖片、視頻和文字)以原創、轉載和分享為主,文章觀點不代表本網站立場,如果涉及侵權請聯系站長郵箱:is@yisu.com進行舉報,并提供相關證據,一經查實,將立刻刪除涉嫌侵權內容。