溫馨提示×
您好,登錄后才能下訂單哦!
點擊 登錄注冊 即表示同意《億速云用戶服務條款》
您好,登錄后才能下訂單哦!
小編給大家分享一下jQuery插件echarts如何設置折線圖中折線線條顏色和折線點顏色,相信大部分人都還不怎么了解,因此分享這篇文章給大家參考一下,希望大家閱讀完這篇文章后大有收獲,下面讓我們一起去了解一下吧!
1、問題背景
設計一條折線圖,但是圖形中不用插件自帶的顏色,需要自定義線條和折點的顏色
2、實現源碼
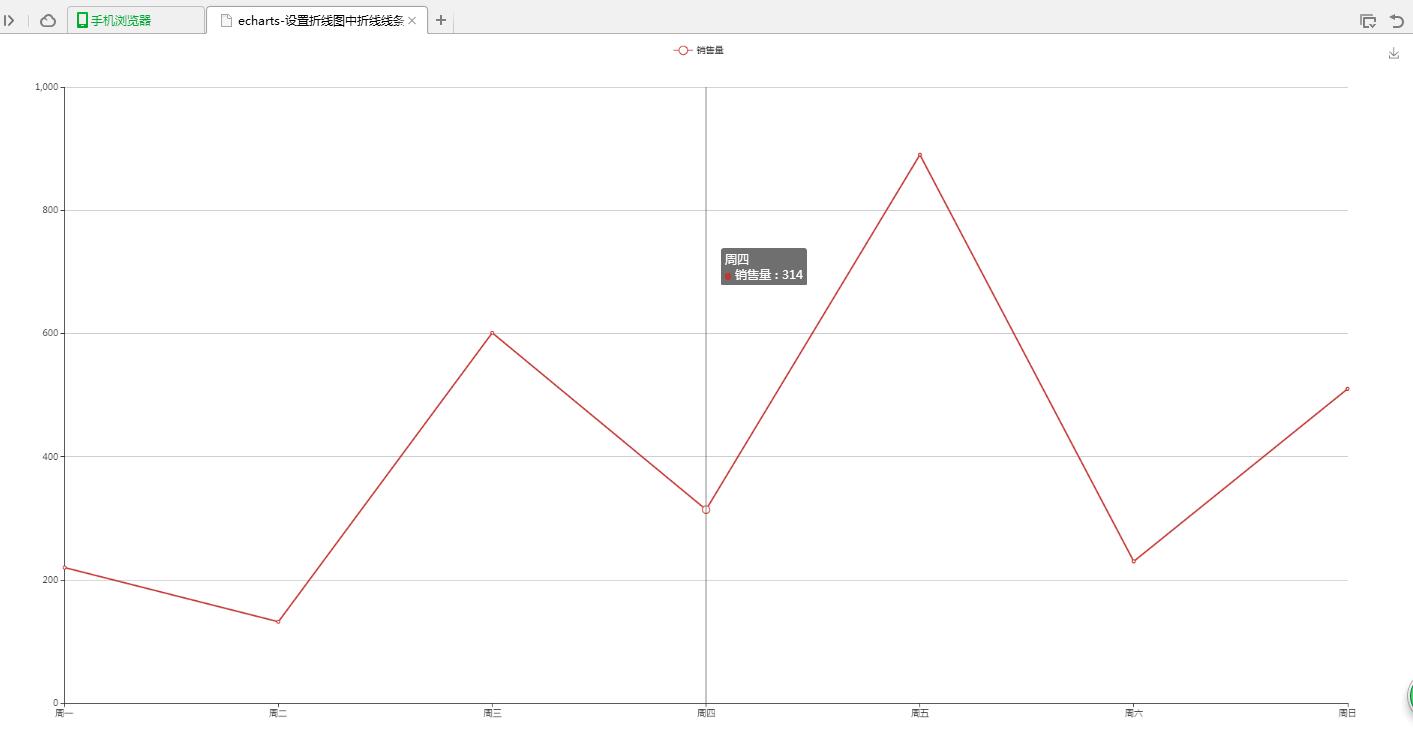
(1)圖形自分配顏色
<!DOCTYPE html>
<html>
  <head>
    <meta charset="UTF-8">
    <title>echarts-設置折線圖中折線線條顏色和折線點顏色</title>
    <link rel="shortcut icon" href="../js/echarts-2.2.7/doc/asset/ico/favicon.png" rel="external nofollow" rel="external nofollow" rel="external nofollow" >
    <script type="text/javascript" src="../js/echarts-2.2.7/doc/asset/js/jquery.min.js" ></script>
    <script type="text/javascript" src="../js/echarts-2.2.7/doc/example/www2/js/echarts-all.js" ></script>
    <style>
      body,html{
        width: 99%;
        height: 99%;
        font-family: "微軟雅黑";
        font-size: 12px;
      }
      #line{
        width: 100%;
        height: 100%;
      }
    </style>
    <script>
      $(function(){
        var chart = document.getElementById('line');
        var echart = echarts.init(chart);
        var option = {
          title: {
            text: ''
          },
          tooltip: {
            trigger: 'axis'
          },
          legend: {
            data:['銷售量']
          },
          grid: {
            left: '3%',
            right: '4%',
            bottom: '3%',
            containLabel: true
          },
          toolbox: {
            feature: {
              saveAsImage: {}
            }
          },
          xAxis: {
            type: 'category',
            boundaryGap: false,
            data: ['周一','周二','周三','周四','周五','周六','周日']
          },
          yAxis: {
            type: 'value'
          },
          series: [
            {
              name:'銷售量',
              type:'line',
              stack: '銷售量',
              data:[220, 132, 601, 314, 890, 230, 510]
            }
          ]
        };
        echart.setOption(option);
      });
    </script>
  </head>
  <body>
    <div id="line"></div>
  </body>
</html>
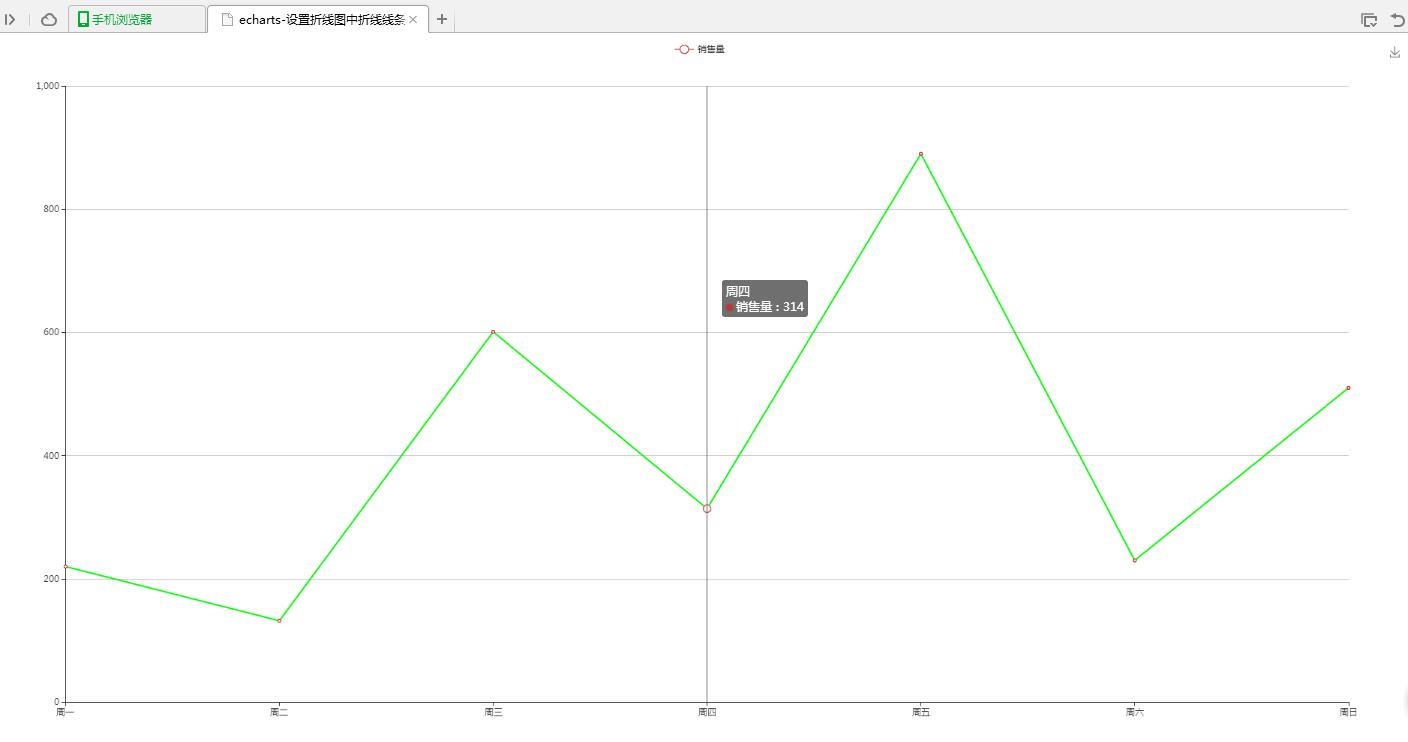
(2)線條自定義顏色
<!DOCTYPE html>
<html>
  <head>
    <meta charset="UTF-8">
    <title>echarts-設置折線圖中折線線條顏色和折線點顏色</title>
    <link rel="shortcut icon" href="../js/echarts-2.2.7/doc/asset/ico/favicon.png" rel="external nofollow" rel="external nofollow" rel="external nofollow" >
    <script type="text/javascript" src="../js/echarts-2.2.7/doc/asset/js/jquery.min.js" ></script>
    <script type="text/javascript" src="../js/echarts-2.2.7/doc/example/www2/js/echarts-all.js" ></script>
    <style>
      body,html{
        width: 99%;
        height: 99%;
        font-family: "微軟雅黑";
        font-size: 12px;
      }
      #line{
        width: 100%;
        height: 100%;
      }
    </style>
    <script>
      $(function(){
        var chart = document.getElementById('line');
        var echart = echarts.init(chart);
        var option = {
          title: {
            text: ''
          },
          tooltip: {
            trigger: 'axis'
          },
          legend: {
            data:['銷售量']
          },
          grid: {
            left: '3%',
            right: '4%',
            bottom: '3%',
            containLabel: true
          },
          toolbox: {
            feature: {
              saveAsImage: {}
            }
          },
          xAxis: {
            type: 'category',
            boundaryGap: false,
            data: ['周一','周二','周三','周四','周五','周六','周日']
          },
          yAxis: {
            type: 'value'
          },
          series: [
            {
              name:'銷售量',
              type:'line',
              stack: '銷售量',
              itemStyle : {
                normal : {
                  lineStyle:{
                    color:'#00FF00'
                  }
                }
              },
              data:[220, 132, 601, 314, 890, 230, 510]
            }
          ]
        };
        echart.setOption(option);
      });
    </script>
  </head>
  <body>
    <div id="line"></div>
  </body>
</html>
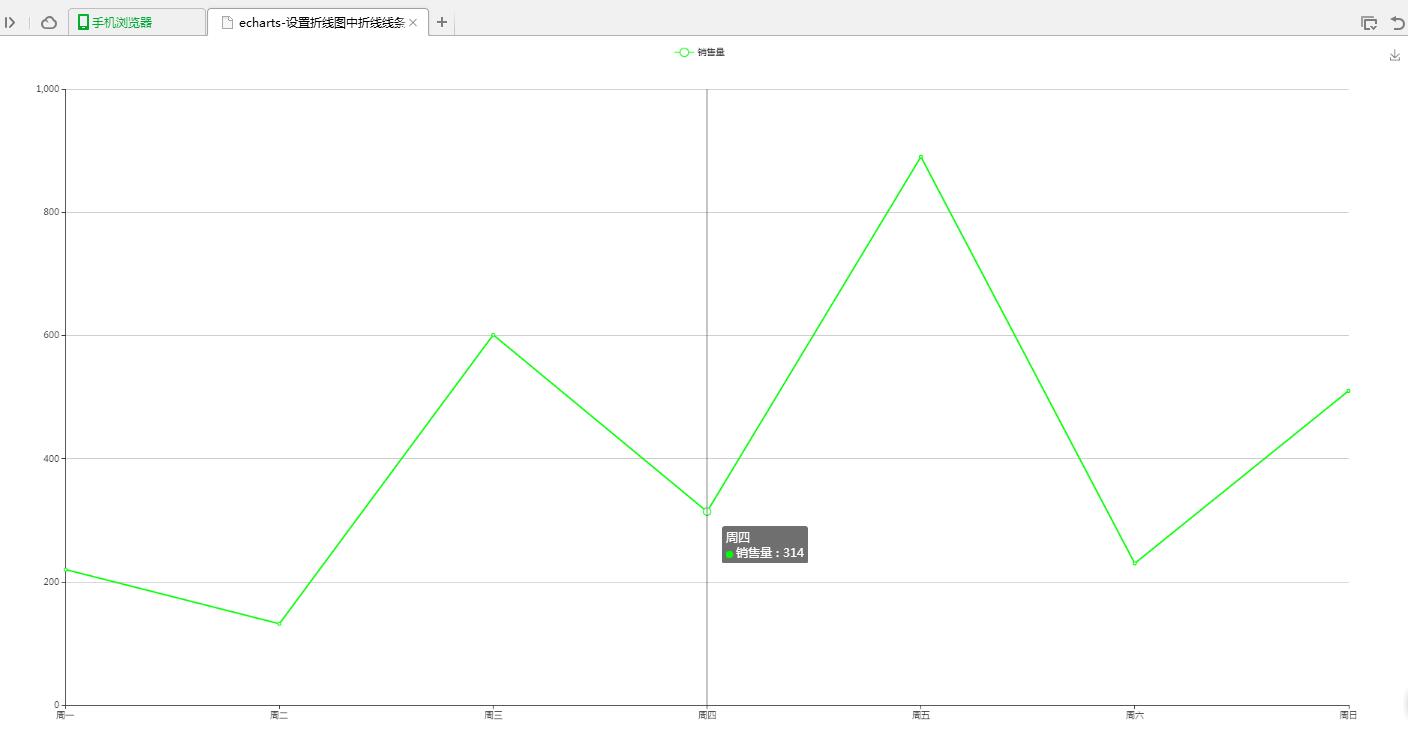
(3)折點自定義顏色
<!DOCTYPE html>
<html>
  <head>
    <meta charset="UTF-8">
    <title>echarts-設置折線圖中折線線條顏色和折線點顏色</title>
    <link rel="shortcut icon" href="../js/echarts-2.2.7/doc/asset/ico/favicon.png" rel="external nofollow" rel="external nofollow" rel="external nofollow" >
    <script type="text/javascript" src="../js/echarts-2.2.7/doc/asset/js/jquery.min.js" ></script>
    <script type="text/javascript" src="../js/echarts-2.2.7/doc/example/www2/js/echarts-all.js" ></script>
    <style>
      body,html{
        width: 99%;
        height: 99%;
        font-family: "微軟雅黑";
        font-size: 12px;
      }
      #line{
        width: 100%;
        height: 100%;
      }
    </style>
    <script>
      $(function(){
        var chart = document.getElementById('line');
        var echart = echarts.init(chart);
        var option = {
          title: {
            text: ''
          },
          tooltip: {
            trigger: 'axis'
          },
          legend: {
            data:['銷售量']
          },
          grid: {
            left: '3%',
            right: '4%',
            bottom: '3%',
            containLabel: true
          },
          toolbox: {
            feature: {
              saveAsImage: {}
            }
          },
          xAxis: {
            type: 'category',
            boundaryGap: false,
            data: ['周一','周二','周三','周四','周五','周六','周日']
          },
          yAxis: {
            type: 'value'
          },
          series: [
            {
              name:'銷售量',
              type:'line',
              stack: '銷售量',
              itemStyle : {
                normal : {
                  color:'#00FF00',
                  lineStyle:{
                    color:'#00FF00'
                  }
                }
              },
              data:[220, 132, 601, 314, 890, 230, 510]
            }
          ]
        };
        echart.setOption(option);
      });
    </script>
  </head>
  <body>
    <div id="line"></div>
  </body>
</html>
3、實現結果
(1)圖形自分配顏色

(2)線條自定義顏色

(3)折點自定義顏色

4、問題說明
(1)設置折線線條顏色
lineStyle:{
 color:'#00FF00'
}
(2)設置折線折點顏色
itemStyle : {
 normal : {
  color:'#00FF00'
 }
}
以上是“jQuery插件echarts如何設置折線圖中折線線條顏色和折線點顏色”這篇文章的所有內容,感謝各位的閱讀!相信大家都有了一定的了解,希望分享的內容對大家有所幫助,如果還想學習更多知識,歡迎關注億速云行業資訊頻道!
免責聲明:本站發布的內容(圖片、視頻和文字)以原創、轉載和分享為主,文章觀點不代表本網站立場,如果涉及侵權請聯系站長郵箱:is@yisu.com進行舉報,并提供相關證據,一經查實,將立刻刪除涉嫌侵權內容。