溫馨提示×
您好,登錄后才能下訂單哦!
點擊 登錄注冊 即表示同意《億速云用戶服務條款》
您好,登錄后才能下訂單哦!
小編給大家分享一下js如何實現一個Canvas統計圖插件,相信大部分人都還不怎么了解,因此分享這篇文章給大家參考一下,希望大家閱讀完這篇文章后大有收獲,下面讓我們一起去了解一下吧!
先說下實現的功能吧:
1.可以通過自定義X軸坐標屬性和Y軸坐標屬性按比例畫出統計圖
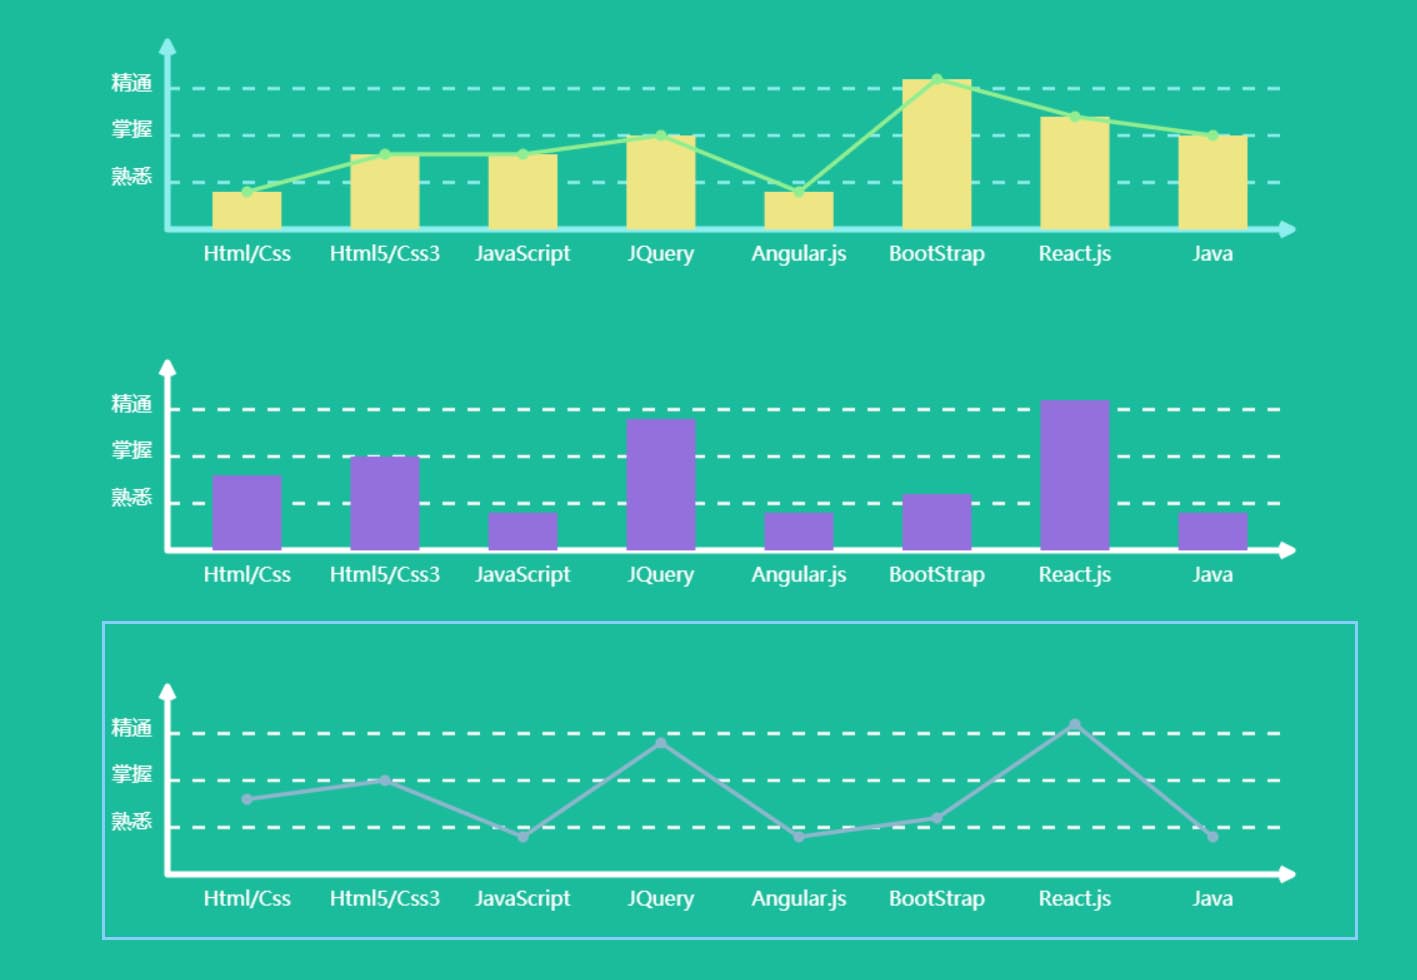
2.可以選擇畫折現圖還是柱形統計圖,或者兩者都實現
3.可以自由定義折現顏色,坐標顏色,柱形圖顏色 和canvas邊框顏色,當然邊框你也可以選擇要或者不要
4.可以選擇是否實現柱形圖和折現圖的動畫實現
實現過程
畫坐標——畫箭頭——做X軸和Y軸的標注——畫柱形圖——畫折現圖
話不多說,上代碼
(function(window,document){
 var ChartDraws = function(options){
  if(!(this instanceof ChartDraws))return new ChartDraws(options);
  this.options = $.extend({
   //報表所需的參數
   "containerId" : "",  //canvas所在容器id
   "canvasWidth" : 400,
   "canvasHeight" : 300,
   "paddingLeft" : 20,
   "paddingTop" : 20,
   "columnChartData" :[], //柱形圖的數量和對應得名稱以及百分比
   "yChartData" :[],   //y軸的數量及名稱
   "axisColor" : "white",  //坐標軸顏色
   "columnChartColor" : "#EEE685", //柱形圖顏色
   "isNeedAnimation" : true, //是否需要動畫
   "isNeedLineChart" : true, //是否需要折線圖
   "isNeedColumnChart" : true, //是否需要柱形圖
   "lineChartColor" : "#90EE90", //折線圖顏色,當isNeedLineChart=true時有效
   "isNeedBorder" : false,  //canvas是否需要外邊框
   "borderColor" : "white"  //外邊框顏色
  },options);
  if(this.options.canvasWidth<=500)
  {
   this.axisBorderWidth = 3;
   this.fontSize = 8;
  }
  else if(this.options.canvasWidth<=800){
   this.axisBorderWidth = 4;
   this.fontSize = 12;
  }
  else{
   this.axisBorderWidth = 5;
   this.fontSize = 16;
  }
  var self = this;
  _init();
  function _init(){
   var canvasDom = document.createElement("canvas");
   canvasDom.id = self.options.containerId+"_"+"canvas";
   canvasDom.width = self.options.canvasWidth;
   canvasDom.height = self.options.canvasHeight;
   if(self.options.isNeedBorder){
    canvasDom.style.borderWidth = 1;
    canvasDom.style.borderStyle = "solid";
    canvasDom.style.borderColor = self.options.borderColor;
   }
   document.getElementById(self.options.containerId).appendChild(canvasDom);
   self.context = document.getElementById(self.options.containerId+"_"+"canvas");
   self.ctx = self.context.getContext("2d");
   _drawAxis();
  }

  function _drawAxis(){
   var XYData =transformAxis( [{x:self.options.paddingLeft,y:self.options.canvasHeight-self.options.paddingTop},{x:self.options.paddingLeft,y:self.options.paddingTop},{x:self.options.canvasWidth-self.options.paddingLeft,y:self.options.paddingTop}]);
   self.ctx.strokeStyle=self.options.axisColor;
   drawLine(self.ctx,XYData,self.axisBorderWidth);
   //畫三角箭頭
   //畫y軸三角箭頭
   drawLine(self.ctx,transformAxis([{x:self.options.paddingLeft-self.axisBorderWidth,y:self.options.canvasHeight-self.options.paddingTop-self.axisBorderWidth*2},{x:self.options.paddingLeft,y:self.options.canvasHeight-self.options.paddingTop},{x:self.options.paddingLeft+self.axisBorderWidth,y:self.options.canvasHeight-self.options.paddingTop-self.axisBorderWidth*2}]),self.axisBorderWidth);
   //畫x軸三角箭頭
   drawLine(self.ctx,transformAxis([{x:self.options.canvasWidth-self.options.paddingLeft-self.axisBorderWidth*2,y:self.options.paddingTop+self.axisBorderWidth},{x:self.options.canvasWidth-self.options.paddingLeft,y:self.options.paddingTop},{x:self.options.canvasWidth-self.options.paddingLeft-self.axisBorderWidth*2,y:self.options.paddingTop-self.axisBorderWidth}]),self.axisBorderWidth);
   _drawCoordinatePoints();
  }

  function _drawCoordinatePoints(){
   self.reactAngleWidth = (1-2*0.04)*(self.options.canvasWidth-(2*self.options.paddingLeft))/(self.options.columnChartData.length*2-1);
   self.lineDataList = [];
   for(var i = 0;i<self.options.columnChartData.length;i++)
   {
    drawXText(self.ctx,2*self.options.columnChartData[i].NO*self.reactAngleWidth+self.options.paddingLeft+0.04*(self.options.canvasWidth-(2*self.options.paddingLeft))+self.reactAngleWidth/2,self.options.paddingTop/2,self.options.columnChartData[i].Name);
    self.lineDataList.push({
     x:2*self.options.columnChartData[i].NO*self.reactAngleWidth+self.options.paddingLeft+0.04*(self.options.canvasWidth-(2*self.options.paddingLeft))+self.reactAngleWidth/2,
     y:self.options.canvasHeight-(self.options.paddingTop+(self.options.canvasHeight-2*self.options.paddingTop)*self.options.columnChartData[i].PT)
    })
   }

   //畫Y軸title 畫y軸虛線
   self.reactAngleHeight = (self.options.canvasHeight-2*self.options.paddingTop)/(self.options.yChartData.length+1);
   for(var j = 0;j<self.options.yChartData.length;j++)
   {
    drawYText(self.ctx,3*self.options.paddingLeft/4,self.options.paddingTop+self.reactAngleHeight*(j+1),self.options.yChartData[j].Name);
    //畫虛線
    drawDottedLine(self.ctx,self.options.paddingLeft,self.options.paddingTop+self.reactAngleHeight*(j+1),self.options.canvasWidth-self.options.paddingLeft,self.options.paddingTop+self.reactAngleHeight*(j+1),self.options.canvasWidth-2*self.options.paddingLeft,10,self.axisBorderWidth/2);
   }
   _drawColumnChart();
  }

  function _drawColumnChart(){
   //柱形圖循環
   var reactAngleTimer = 1;
   function loopColumnChart()
   {
    var columnChartLooped = window.requestAnimationFrame(loopColumnChart);
    if(reactAngleTimer<=100)
    {
     for(var k=0;k<self.options.columnChartData.length;k++)
     {
      self.ctx.fillStyle =self.options.columnChartColor;
      drawRectangle(self.ctx,self.lineDataList[k].x-self.reactAngleWidth/2,self.options.canvasHeight-((self.options.canvasHeight-2*self.options.paddingTop)*self.options.columnChartData[k].PT*reactAngleTimer/100+self.options.paddingTop),self.reactAngleWidth,(self.options.canvasHeight-2*self.options.paddingTop)*self.options.columnChartData[k].PT*reactAngleTimer/100);
     }
     reactAngleTimer++;
    }
    else
    {
     window.cancelAnimationFrame(columnChartLooped);
     columnChartLooped = null;
     reactAngleTimer = 1;
     if(self.options.isNeedLineChart)
     {
      loopLineChart();
     }
    }
   }
   //折線圖循環
   var lineTimer = 0;
   function loopLineChart()
   {
    var lineChartLooped = window.requestAnimationFrame(loopLineChart);
    if(lineTimer<self.lineDataList.length-1)
    {
     self.ctx.lineWidth = 2*self.axisBorderWidth/3;
     if(lineTimer == 0)
     {
      drawCircle(self.ctx,self.lineDataList[lineTimer].x,self.lineDataList[lineTimer].y);
     }
     drawCircle(self.ctx,self.lineDataList[lineTimer+1].x,self.lineDataList[lineTimer+1].y);
     self.ctx.beginPath();
     self.ctx.moveTo(self.lineDataList[lineTimer].x,self.lineDataList[lineTimer].y);
     self.ctx.lineTo(self.lineDataList[lineTimer+1].x,self.lineDataList[lineTimer+1].y);
     self.ctx.strokeStyle = self.options.lineChartColor;
     self.ctx.lineWidth = 2*self.axisBorderWidth/3;
     self.ctx.stroke();
     lineTimer++;
    }
    else
    {
     window.cancelAnimationFrame(lineChartLooped);
     lineChartLooped = null;
     lineTimer = 0;
    }
   }
   //畫柱形圖
   function drawRectangle(context,x,y,width,height){
    context.beginPath();
    context.fillRect(x,y,width,height);
   }
   //畫圓
   function drawCircle(context,x,y){
    context.beginPath();
    context.arc(x,y,self.axisBorderWidth/2,0,2*Math.PI,true);
    context.strokeStyle=self.options.lineChartColor;
    context.stroke();
    context.closePath();
   }
   if(self.options.isNeedAnimation)
   {
    if(self.options.isNeedColumnChart)
    {
     loopColumnChart();
    }
    else
    {
     if(self.options.isNeedLineChart) {
      loopLineChart();
     }
    }
   }
   else
   {
    if(self.options.isNeedColumnChart)
    {
     for(var k=0;k<self.options.columnChartData.length;k++)
     {
      self.ctx.fillStyle =self.options.columnChartColor;
      drawRectangle(self.ctx,self.lineDataList[k].x-self.reactAngleWidth/2,self.options.canvasHeight-((self.options.canvasHeight-2*self.options.paddingTop)*self.options.columnChartData[k].PT+self.options.paddingTop),self.reactAngleWidth,(self.options.canvasHeight-2*self.options.paddingTop)*self.options.columnChartData[k].PT);
     }
    }
    if(self.options.isNeedLineChart) {
     for (var l = 0; l < self.lineDataList.length - 1; l++) {
      self.ctx.lineWidth = 4;
      if (l == 0) {
       drawCircle(self.ctx, self.lineDataList[l].x, self.lineDataList[l].y);
      }
      drawCircle(self.ctx, self.lineDataList[l + 1].x, self.lineDataList[l + 1].y);
      self.ctx.beginPath();
      self.ctx.moveTo(self.lineDataList[l].x, self.lineDataList[l].y);
      self.ctx.lineTo(self.lineDataList[l + 1].x, self.lineDataList[l + 1].y);
      self.ctx.strokeStyle = self.options.lineChartColor;
      self.ctx.lineWidth = 2*self.axisBorderWidth/3;
      self.ctx.stroke();
     }
    }
   }
  }


  function transformAxis(data)
  {
   var newData=[];
   for(var i=0;i<data.length;i++){
    newData.push({
     x:data[i].x,
     y:self.options.canvasHeight-data[i].y
    })
   }
   return newData;
  }

  function drawLine(context,point,width){
   context.beginPath();
   context.moveTo(point[0].x,point[0].y);
   if(point.length>2)
   {
    for(var i=1;i<point.length;i++)
    {
     context.lineTo(point[i].x,point[i].y);
    }
   }
   context.lineWidth = width;
   context.lineJoin='round';
   context.stroke();
   context.closePath();
  }

  //畫y軸title
  function drawYText(context,x,y,str) {
   context.beginPath();
   context.font = '{fontSize} Microsoft Yahei'.replace("{fontSize}",self.fontSize+"px");
   context.fillStyle = 'white';
   context.textAlign = 'right';
   context.fillText(str,x,self.options.canvasHeight-y);
   context.closePath();
  }
  //畫x軸title
  function drawXText(context,x,y,str) {
   context.beginPath();
   context.font = '{fontSize} Microsoft Yahei'.replace("{fontSize}",self.fontSize+"px");
   context.fillStyle = 'white';
   context.textAlign = 'center';
   context.fillText(str,x,self.options.canvasHeight-y);
   context.closePath();
  }
  function drawDottedLine(context,x1,y1,x2,y2,totalLength,length,lineWidth){
   y1 = self.options.canvasHeight-y1;
   y2 = self.options.canvasHeight-y2;
   var dashLen = length === undefined ? 5 : length;
   //計算有多少個線段
   context.beginPath();
   var num = Math.floor(totalLength/dashLen);
   context.lineWidth = lineWidth;
   for(var i = 0 ; i < num; i++)
   {
    context[i%2==0 ? 'moveTo' : 'lineTo'](x1+(x2-x1)/num*i,y1+(y2-y1)/num*i);
   }
   context.stroke();
  }
 };
 window.ChartDraws = ChartDraws;
}(window,document));
下面還有一個是實現requestAnimationFrame瀏覽器兼容的
(function(){
 var lastTime = 0;
 var prefixes = ['ms','webkit','o','moz']; //各瀏覽器前綴

 var requestAnimationFrame = window.requestAnimationFrame;
 var cancelAnimationFrame = window.cancelAnimationFrame;

 var prefix;
 //通過遍歷各瀏覽器前綴,來得到requestAnimationFrame和cancelAnimationFrame在當前瀏覽器的實現形式
 for( var i = 0; i < prefixes.length; i++ ) {
  if ( requestAnimationFrame && cancelAnimationFrame ) {
   break;
  }
  prefix = prefixes[i];
  requestAnimationFrame = requestAnimationFrame || window[ prefix + 'RequestAnimationFrame' ];
  cancelAnimationFrame = cancelAnimationFrame || window[ prefix + 'CancelAnimationFrame' ] || window[ prefix + 'CancelRequestAnimationFrame' ];
 }

 //如果當前瀏覽器不支持requestAnimationFrame和cancelAnimationFrame,則會退到setTimeout
 if ( !requestAnimationFrame || !cancelAnimationFrame ) {
  requestAnimationFrame = function( callback, element ) {
   var currTime = new Date().getTime();
   //為了使setTimteout的盡可能的接近每秒60幀的效果
   var timeToCall = Math.max( 0, 16 - ( currTime - lastTime ) );
   var id = window.setTimeout( function() {
    callback( currTime + timeToCall );
   }, timeToCall );
   lastTime = currTime + timeToCall;
   return id;
  };
  cancelAnimationFrame = function( id ) {
   window.clearTimeout( id );
  };
 }

 window.requestAnimationFrame = requestAnimationFrame;
 window.cancelAnimationFrame = cancelAnimationFrame;
}());
附上<script>調用
ChartDraws({
  "containerId" : "chart1",  //canvas所在容器id
  "canvasWidth" : 1000,
  "canvasHeight" : 250,
  "paddingLeft" : 50,
  "paddingTop" : 50,
  "columnChartData": [
   {NO:0,PT:0.2,Name:"Html/Css"},
   {NO:1,PT:0.4,Name:"Html5/Css3"},
   {NO:2,PT:0.4,Name:"JavaScript"},
   {NO:3,PT:0.5,Name:"JQuery"},
   {NO:4,PT:0.2,Name:"Angular.js"},
   {NO:5,PT:0.8,Name:"BootStrap"},
   {NO:6,PT:0.6,Name:"React.js"},
   {NO:7,PT:0.5,Name:"Java"}
  ],
  "yChartData" : [
   {NO:0,Name:"熟悉"},
   {NO:1,Name:"掌握"},
   {NO:2,Name:"精通"}
  ],
  "isNeedAnimation" : false,
  "isNeedBorder" : false,
  "isNeedLineChart":true,
  "axisColor" : "#8DEEEE"
 });
 ChartDraws({
  "containerId" : "chart2",  //canvas所在容器id
  "canvasWidth" : 1000,
  "canvasHeight" : 250,
  "paddingLeft" : 50,
  "paddingTop" : 50,
  "columnChartData": [
   {NO:0,PT:0.4,Name:"Html/Css"},
   {NO:1,PT:0.5,Name:"Html5/Css3"},
   {NO:2,PT:0.2,Name:"JavaScript"},
   {NO:3,PT:0.7,Name:"JQuery"},
   {NO:4,PT:0.2,Name:"Angular.js"},
   {NO:5,PT:0.3,Name:"BootStrap"},
   {NO:6,PT:0.8,Name:"React.js"},
   {NO:7,PT:0.2,Name:"Java"}
  ],
  "yChartData" : [
   {NO:0,Name:"熟悉"},
   {NO:1,Name:"掌握"},
   {NO:2,Name:"精通"}
  ],
  "isNeedAnimation" : false,
  "isNeedBorder" : false,
  "isNeedLineChart":false,
  "isNeedColumnChart" : true,
  "columnChartColor":"#9370DB"
 });

 ChartDraws({
  "containerId" : "chart3",  //canvas所在容器id
  "canvasWidth" : 1000,
  "canvasHeight" : 250,
  "paddingLeft" : 50,
  "paddingTop" : 50,
  "columnChartData": [
   {NO:0,PT:0.4,Name:"Html/Css"},
   {NO:1,PT:0.5,Name:"Html5/Css3"},
   {NO:2,PT:0.2,Name:"JavaScript"},
   {NO:3,PT:0.7,Name:"JQuery"},
   {NO:4,PT:0.2,Name:"Angular.js"},
   {NO:5,PT:0.3,Name:"BootStrap"},
   {NO:6,PT:0.8,Name:"React.js"},
   {NO:7,PT:0.2,Name:"Java"}
  ],
  "yChartData" : [
   {NO:0,Name:"熟悉"},
   {NO:1,Name:"掌握"},
   {NO:2,Name:"精通"}
  ],
  "isNeedAnimation" : false,
  "isNeedBorder" : true,
  "isNeedLineChart":true,
  "isNeedColumnChart" : false,
  "lineChartColor" : "#8DB6CD",
  "borderColor" : "#87CEFA"
 })
html代碼
<div class="section">
 <div id="chart1"></div>
 <div id="chart2"></div>
 <div id="chart3"></div>
 </div>
下面是一個實現后的效果圖

以上是“js如何實現一個Canvas統計圖插件”這篇文章的所有內容,感謝各位的閱讀!相信大家都有了一定的了解,希望分享的內容對大家有所幫助,如果還想學習更多知識,歡迎關注億速云行業資訊頻道!
免責聲明:本站發布的內容(圖片、視頻和文字)以原創、轉載和分享為主,文章觀點不代表本網站立場,如果涉及侵權請聯系站長郵箱:is@yisu.com進行舉報,并提供相關證據,一經查實,將立刻刪除涉嫌侵權內容。