溫馨提示×
您好,登錄后才能下訂單哦!
點擊 登錄注冊 即表示同意《億速云用戶服務條款》
您好,登錄后才能下訂單哦!
本篇文章為大家展示了怎么在Python中使用matplotlib畫曲線,內容簡明扼要并且容易理解,絕對能使你眼前一亮,通過這篇文章的詳細介紹希望你能有所收獲。
1、云計算,典型應用OpenStack。2、WEB前端開發,眾多大型網站均為Python開發。3.人工智能應用,基于大數據分析和深度學習而發展出來的人工智能本質上已經無法離開python。4、系統運維工程項目,自動化運維的標配就是python+Django/flask。5、金融理財分析,量化交易,金融分析。6、大數據分析。
用 一元一次函數 畫直線
import matplotlib.pyplot as plt
import numpy as np

x = np.linspace(-2, 2, 50)
print(x)
y = 2*x + 1
plt.plot(x, y)
ax = plt.gca()
ax.spines['bottom'].set_position(('data',0))
ax.spines['left'].set_position(('data',0))
plt.show()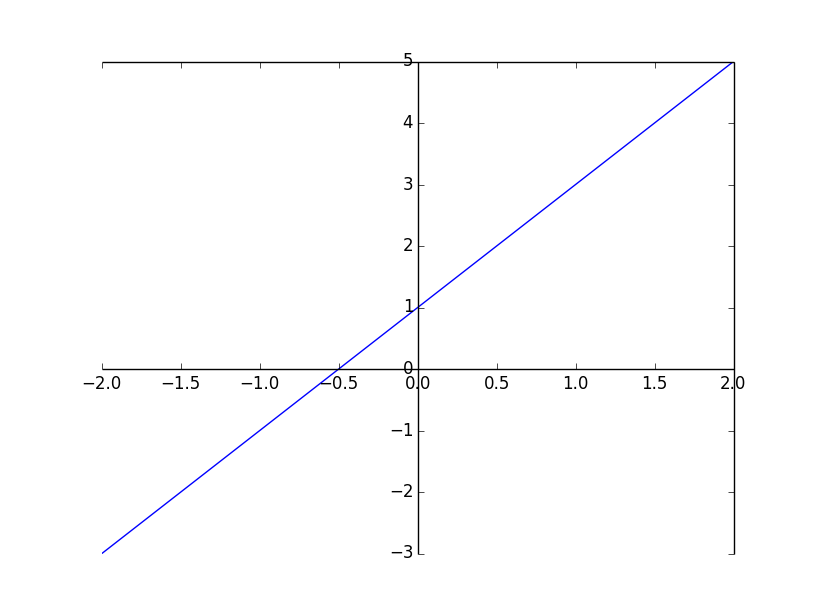
代碼2:用 一元二次函數 畫拋物線
import matplotlib.pyplot as plt
import numpy as np

x = np.linspace(-4, 6, 50)
print(type(x))
print(x)
y = x**2 - x*2+1
plt.plot(x, y)
plt.show()
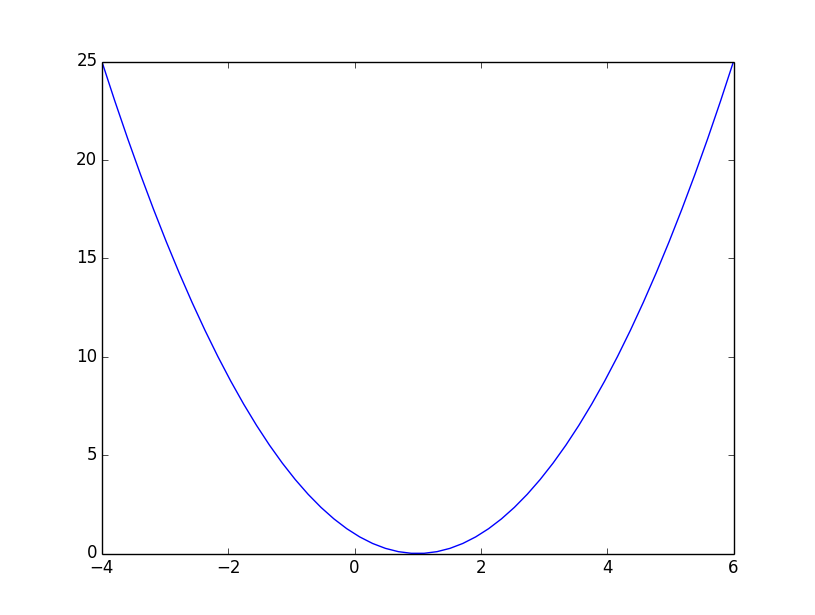
代碼3:用反比例函數 畫曲線
import matplotlib.pyplot as plt
import numpy as np

x = np.linspace(-11, 11, 110)
print(x)
y =10/x
plt.plot(x, y)
ax = plt.gca()
ax.spines['bottom'].set_position(('data',0))
ax.spines['left'].set_position(('data',0))
plt.show()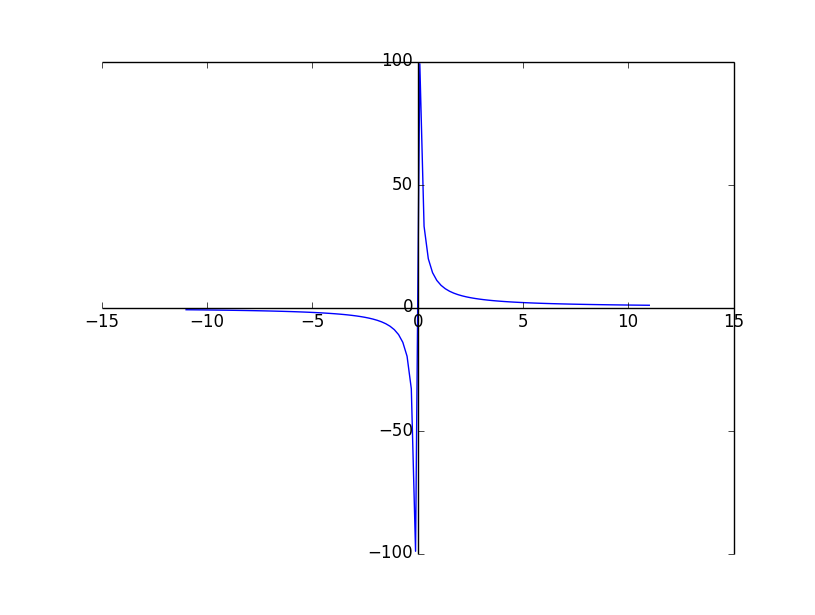
代碼4:子坐標系的應用
import matplotlib.pyplot as plt
fig = plt.figure()
ax1 = fig.add_subplot(221)
ax2 = fig.add_subplot(222)
ax3 = fig.add_subplot(224)
ax1.set(xlim=[0.5, 4.5], ylim=[-2, 8], title='Axes Show',
    ylabel='Y', xlabel='X')
plt.show()
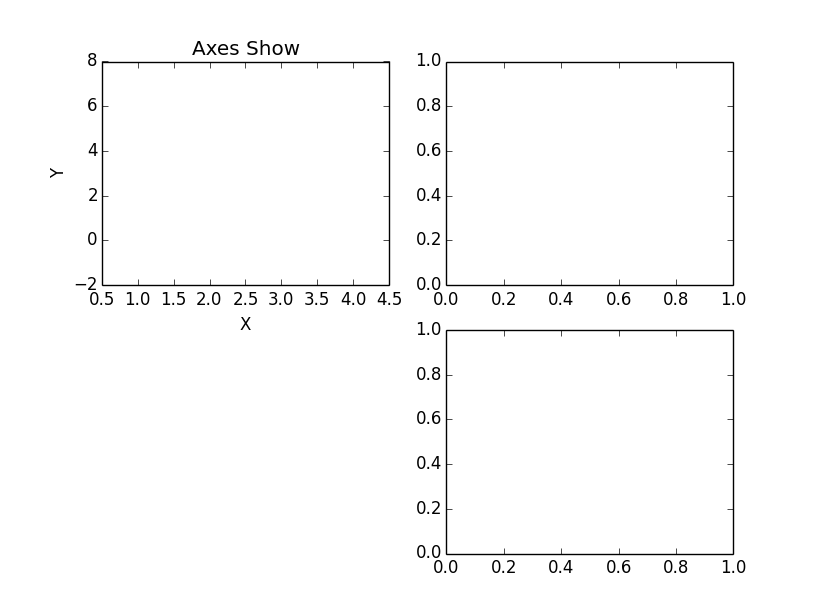
代碼5:子坐標系的應用
import matplotlib.pyplot as plt
fig = plt.figure()
fig,axes=plt.subplots(nrows=2, ncols=2)
axes[0,0].set(xlim=[0.5, 4.5], ylim=[-2, 8], title='Axes Show',
    ylabel='Y', xlabel='X')
axes[0,1].set(title='Upper Right')
axes[1,0].set(title='Lower Left')
axes[1,1].set(title='Lower Right')
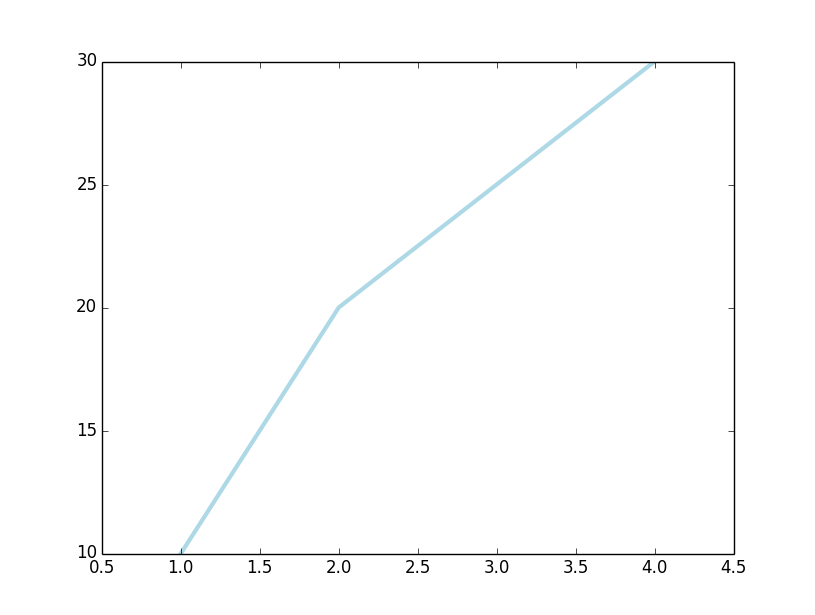
代碼6:用已知少量坐標值畫曲線
import matplotlib.pyplot as plt
plt.plot([1, 2, 3, 4], [10, 20, 25, 30], color='lightblue', linewidth=3)
plt.xlim(0.5, 4.5)
plt.show()
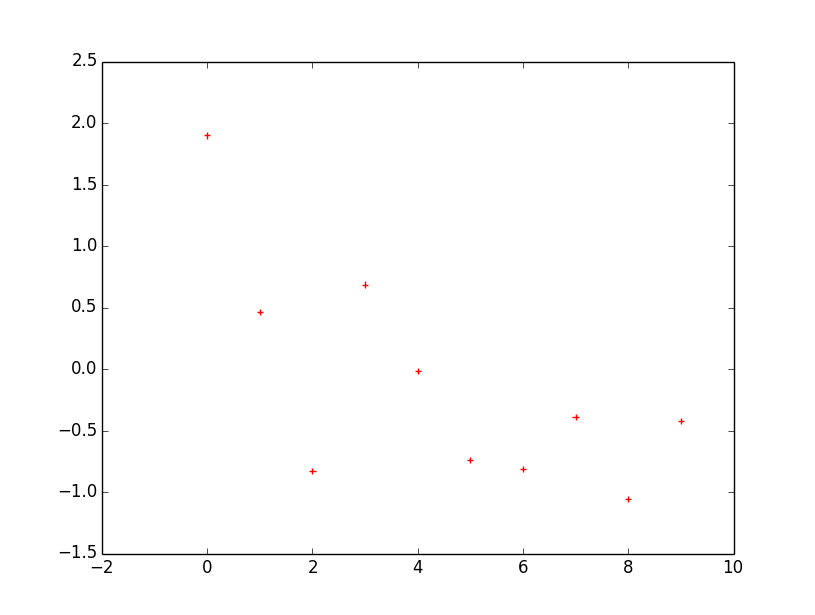
代碼7:畫離散點
mport matplotlib.pyplot as plt
import numpy as np
x = np.arange(10)
y = np.random.randn(10)
print(y)
plt.scatter(x, y, color='red', marker='+')
plt.show()
代碼8:畫出正弦曲線
import numpy as np
import matplotlib.pyplot as plt
x=np.arange(-2*np.pi,2*np.pi,0.01)
y=np.sin(x)
plt.plot(x,y)
ax = plt.gca()
ax.spines['bottom'].set_position(('data',0))
ax.spines['left'].set_position(('data',0))
plt.xticks([-np.pi*2,-np.pi*3/2,-np.pi, -np.pi/2, 0, np.pi/2, np.pi,np.pi*3/2,np.pi*2],[r'$-2\pi$',r'$-\frac{3}{2} \pi$',r'$-\pi$',r'$-\frac{1}{2}\pi$', r'0', r'$\frac{1}{2}\pi$','$\pi$',r'$\frac{3}{2}\pi$',r'$2 \pi$'])
plt.show()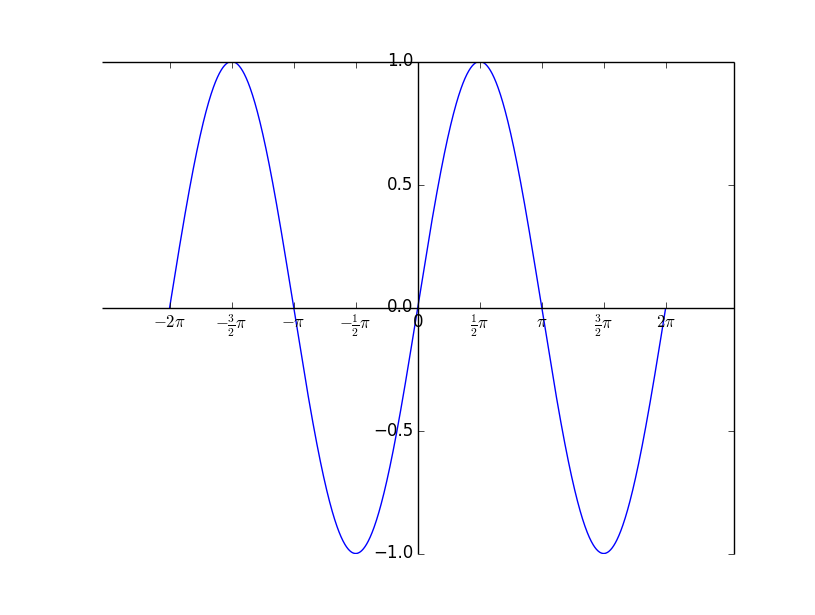
上述內容就是怎么在Python中使用matplotlib畫曲線,你們學到知識或技能了嗎?如果還想學到更多技能或者豐富自己的知識儲備,歡迎關注億速云行業資訊頻道。
免責聲明:本站發布的內容(圖片、視頻和文字)以原創、轉載和分享為主,文章觀點不代表本網站立場,如果涉及侵權請聯系站長郵箱:is@yisu.com進行舉報,并提供相關證據,一經查實,將立刻刪除涉嫌侵權內容。